

Zcash price traded near $1,216 on Sep. 10 after a seven-day rally of more than 50%, but overbought momentum, a three-day sell signal and nearby liquidation clusters raised the risk of a pullback.
Summary
- Zcash price advanced from about $814 to a multi-year high near $1,257 during the seven-day period.
- Daily RSI reached 75.72, keeping ZEC in overbought territory after its rapid breakout.
- 4-hour Bollinger Bands place immediate support at $1,196 and resistance near $1,287.
- Analysts identified $1,000–$1,100 as a possible base if the rally enters a correction.
Zcash price action today
According to data from crypto.news, Zcash (ZEC) price was trading at $1,216.15 at the time of writing, down 2.26% for the session after opening at $1,244.18. The token traded between an intraday low of $1,204.93 and a high of $1,256.80.
Despite the daily decline, ZEC remained one of the strongest large-cap crypto performers over the past week. Its price rose more than 50% from around $814 on Sep. 4 and briefly entered the $1,249–$1,257 area before buyers lost momentum.
The breakout also placed Zcash above $1,000 for the first time in years. Price continued to hold more than $200 above the psychological level at the time of writing, even as Bitcoin and Ethereum faced broader selling pressure.
Derivatives liquidations contributed to the initial acceleration. More than $34.5 million in ZEC short positions were reportedly closed during a 24-hour period as bearish traders were forced to buy back the asset. Short liquidations accounted for about 94% of the total cited liquidations.
Forced buying helped ZEC clear resistance quickly, but the same leverage that drove the advance could increase volatility if traders begin taking profits.
Daily ZEC chart remains overextended
The daily chart shows Zcash trading far above all four moving averages. Its 20-day simple moving average stood at $942.96, while the 50-day, 100-day, and 200-day averages were positioned at $679.76, $573.86, and $468.71, respectively.
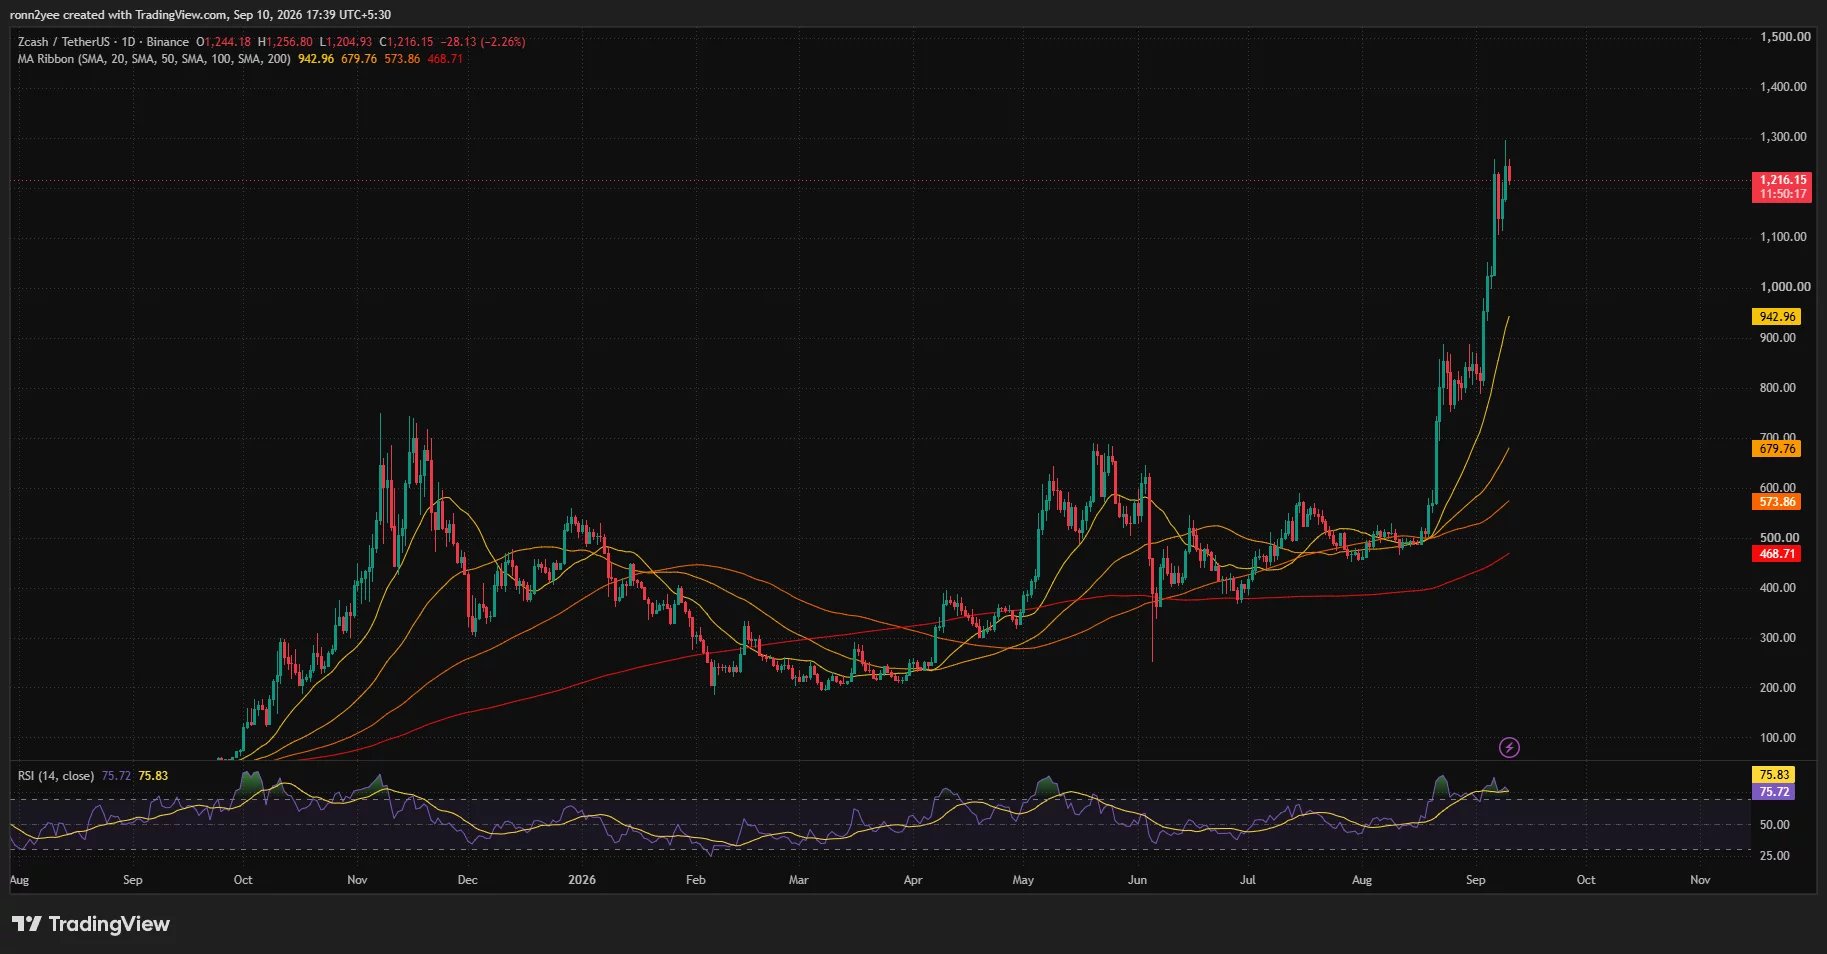
ZEC was therefore about 29% above its 20-day average and more than 159% above its 200-day average. Large gaps between price and long-term moving averages often show strong momentum, but they can also leave an asset vulnerable to mean reversion.
The moving averages remained in bullish order, with the shorter averages positioned above the longer ones. Maintaining that structure would support the broader uptrend even if ZEC experiences a short-term correction.
The daily relative strength index stood at 75.72, with its signal average at 75.83. A reading above 70 is generally treated as overbought, suggesting that the market may need to consolidate before attempting another sustained advance.
The indicator had also eased from its recent peak while ZEC held close to its highs. Continued cooling in the RSI without a sharp price decline could help reduce the overbought condition. A drop in both price and RSI, however, would point to weakening momentum.
4-hour chart puts $1,196 support in focus
Zcash was testing the middle Bollinger Band on the 4-hour chart. The indicator’s midline stood at $1,196.28, making the $1,190–$1,200 range the first support area to watch.
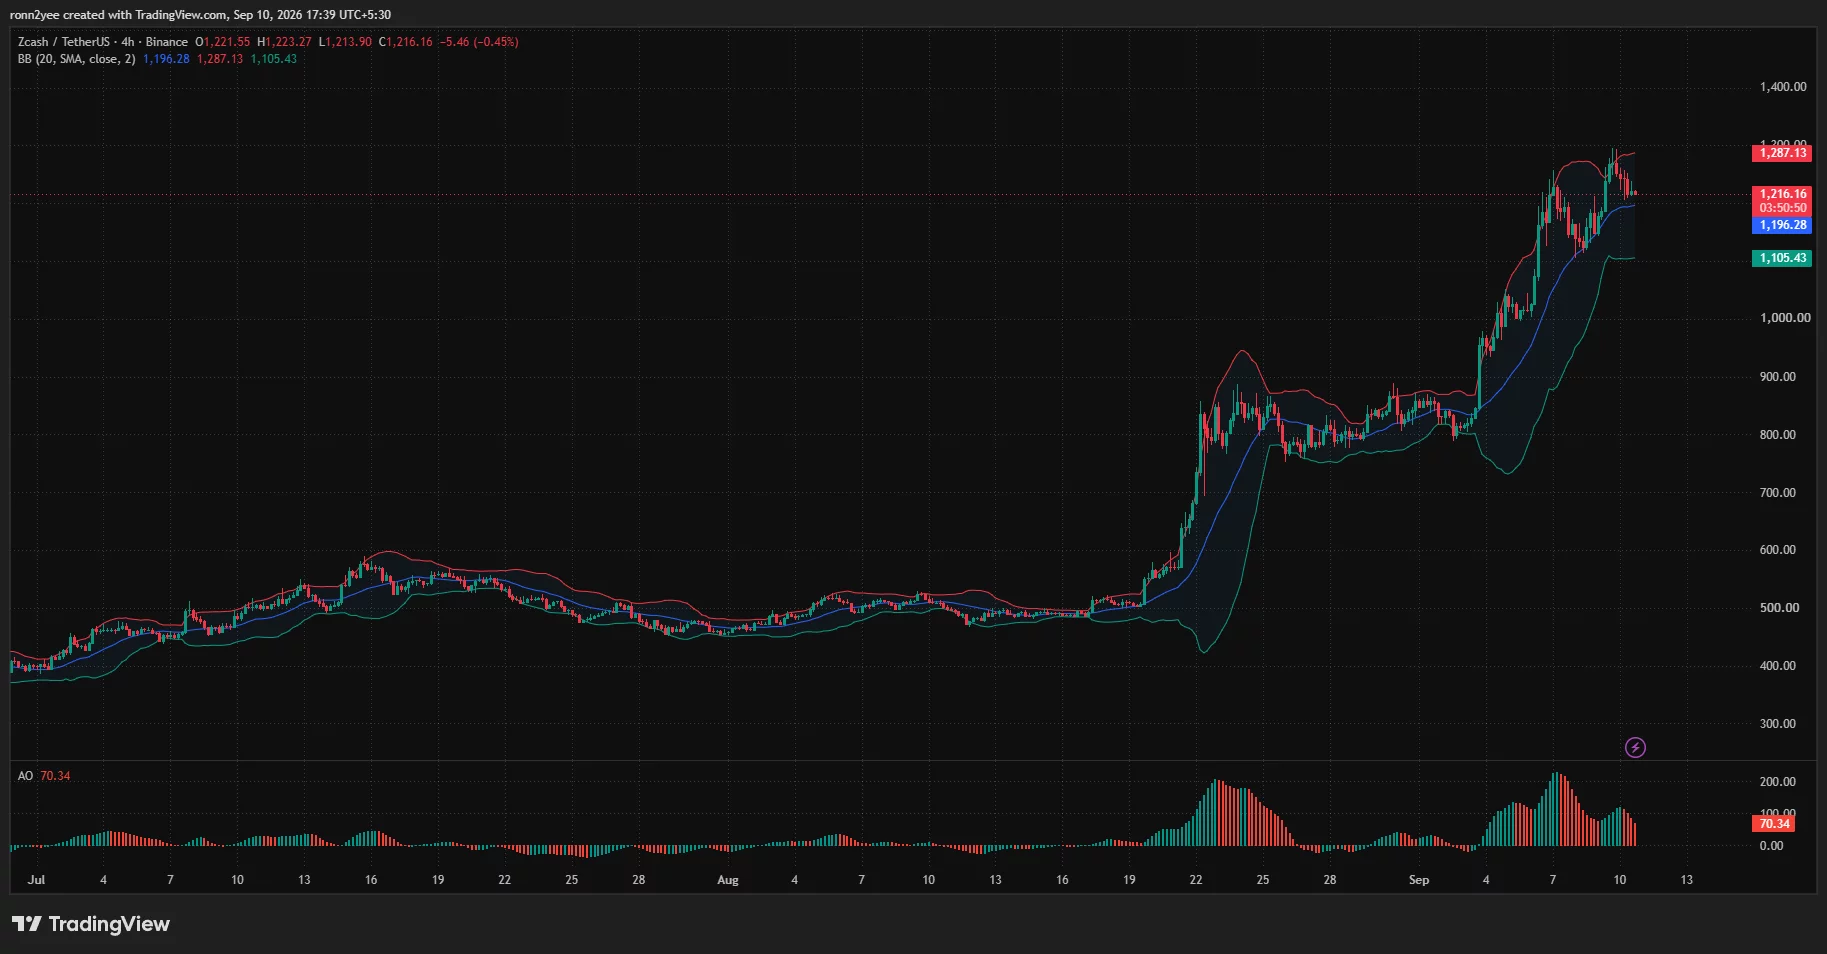
The upper Bollinger Band was located at $1,287.13. A 4-hour close above that level would place ZEC beyond the recent high and could open the way toward the round-number resistance at $1,300.
The lower band stood at $1,105.43, aligning with the wider $1,000–$1,100 demand region identified by crypto trader Altcoin Sherpa. The analyst said both levels were areas of interest but preferred to see ZEC spend time building a base instead of trying to identify an exact bottom.
The Awesome Oscillator remained positive at 70.34, showing that short-term momentum had not turned bearish. Its histogram bars were contracting, however, indicating that the pace of the advance was slowing.
A loss of $1,196 could expose the recent intraday area near $1,170, followed by the lower Bollinger Band around $1,105. A deeper decline would bring the $1,000 breakout level back into focus.
Liquidation map shows pressure on both sides
CoinGlass’ 24-hour ZEC liquidation heatmap placed several liquidity clusters above the market, including concentrations around $1,245–$1,270, $1,290–$1,305 and $1,320.
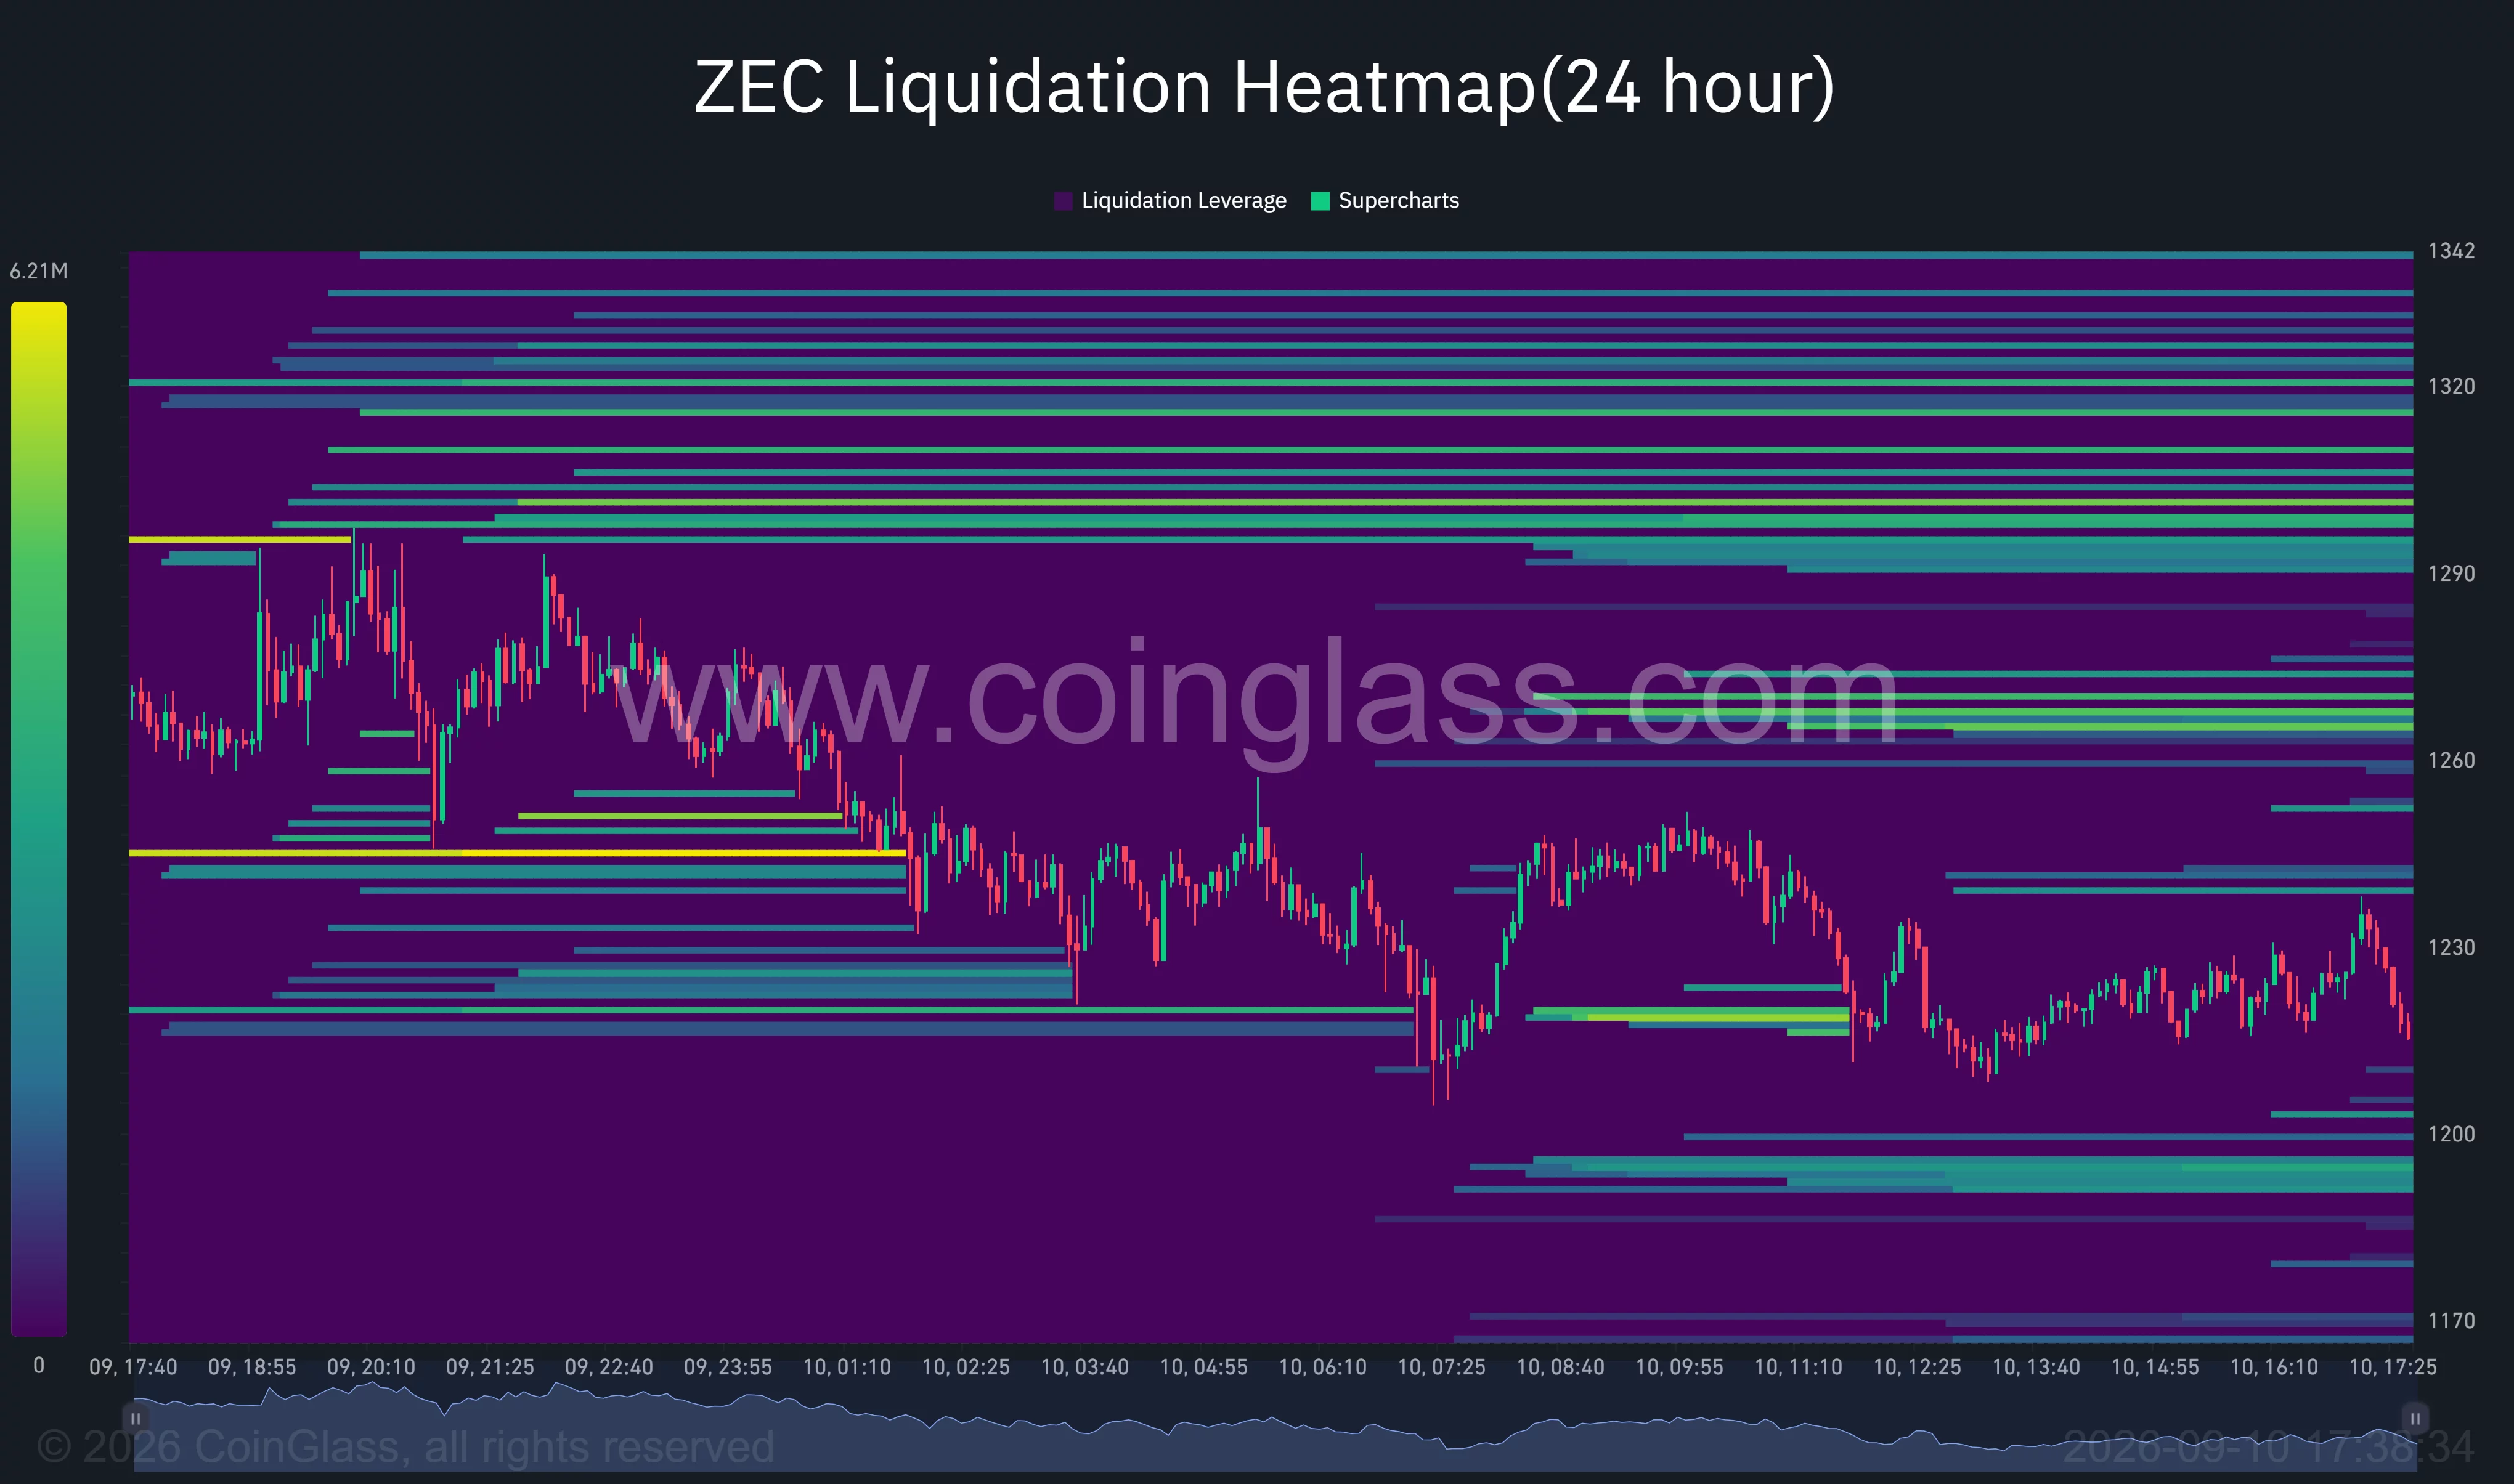
A recovery toward those levels could force short sellers to close positions, adding buy orders to the market. The nearest cluster around $1,245 also overlaps with the latest intraday trading range, making it an immediate barrier for bulls.
Below the market, the heatmap showed liquidity near $1,195–$1,200 and around $1,170. A break under $1,200 could therefore accelerate the decline as leveraged long positions face pressure.
The distribution leaves ZEC between competing liquidity zones. Holding $1,196 would keep the upper clusters within reach, while a clear loss of the level could draw price toward $1,170 or $1,105.
Analysts warn of a Zcash correction
Analyst Ali Martinez said the TD Sequential indicator had produced a sell signal on Zcash’s three-day chart. He compared the setup with a previous signal on May 19 that preceded a 64% correction.
The historical comparison does not mean ZEC will repeat the earlier decline, but it adds to the caution signaled by the elevated daily RSI and contracting 4-hour momentum.
Altcoin Sherpa maintained a longer-term bullish view but said the current move would benefit from a period of consolidation. His chart presented a possible path in which ZEC retreats toward the $1,000–$1,100 area, forms a base, and later resumes its advance.
For US traders, derivatives positioning may remain the key short-term risk after the reported short squeeze. A move above $1,287–$1,300 would strengthen the bullish case, while a sustained break below $1,196 could shift attention toward $1,105 and the former $1,000 resistance zone.
Disclosure: This article does not represent investment advice. The content and materials featured on this page are for educational purposes only.