

Key Takeaways
- XRP’s price trades near $1.29, with technical support at $1.27 and resistance extending toward $1.35.
- XRP futures open interest totals $2.77 billion, down 1.32%, as leverage and aggressive buying weaken.
- Polymarket gives XRP a 50% chance of touching $1.20, while Kalshi traders temper October expectations.
XRP Price Struggles to Find Its Footing as Derivatives Traders Retreat
XRP bulls have their backs against the wall this Sunday, Oct. 18, 2026, with the crypto asset trading near $1.29, futures open interest slipping and prediction market traders increasingly skeptical of a meaningful October recovery. The token has retreated from higher levels earlier this month, leaving buyers defending a narrow band of support while technical indicators continue to favor sellers.
Yet there’s an interesting wrinkle in the numbers. Although the charts look decidedly bearish, falling leverage and deeply oversold oscillators suggest the market may be shedding speculative excess rather than preparing for another wave of aggressive short positioning.
XRP’s Hourly Chart Shows Buyers Fighting for $1.30
The one-hour XRP chart shows a market struggling to establish a convincing recovery after briefly touching $1.27. Price has since consolidated between approximately $1.29 and $1.305, with buyers repeatedly attempting to reclaim the psychologically important $1.30 threshold.
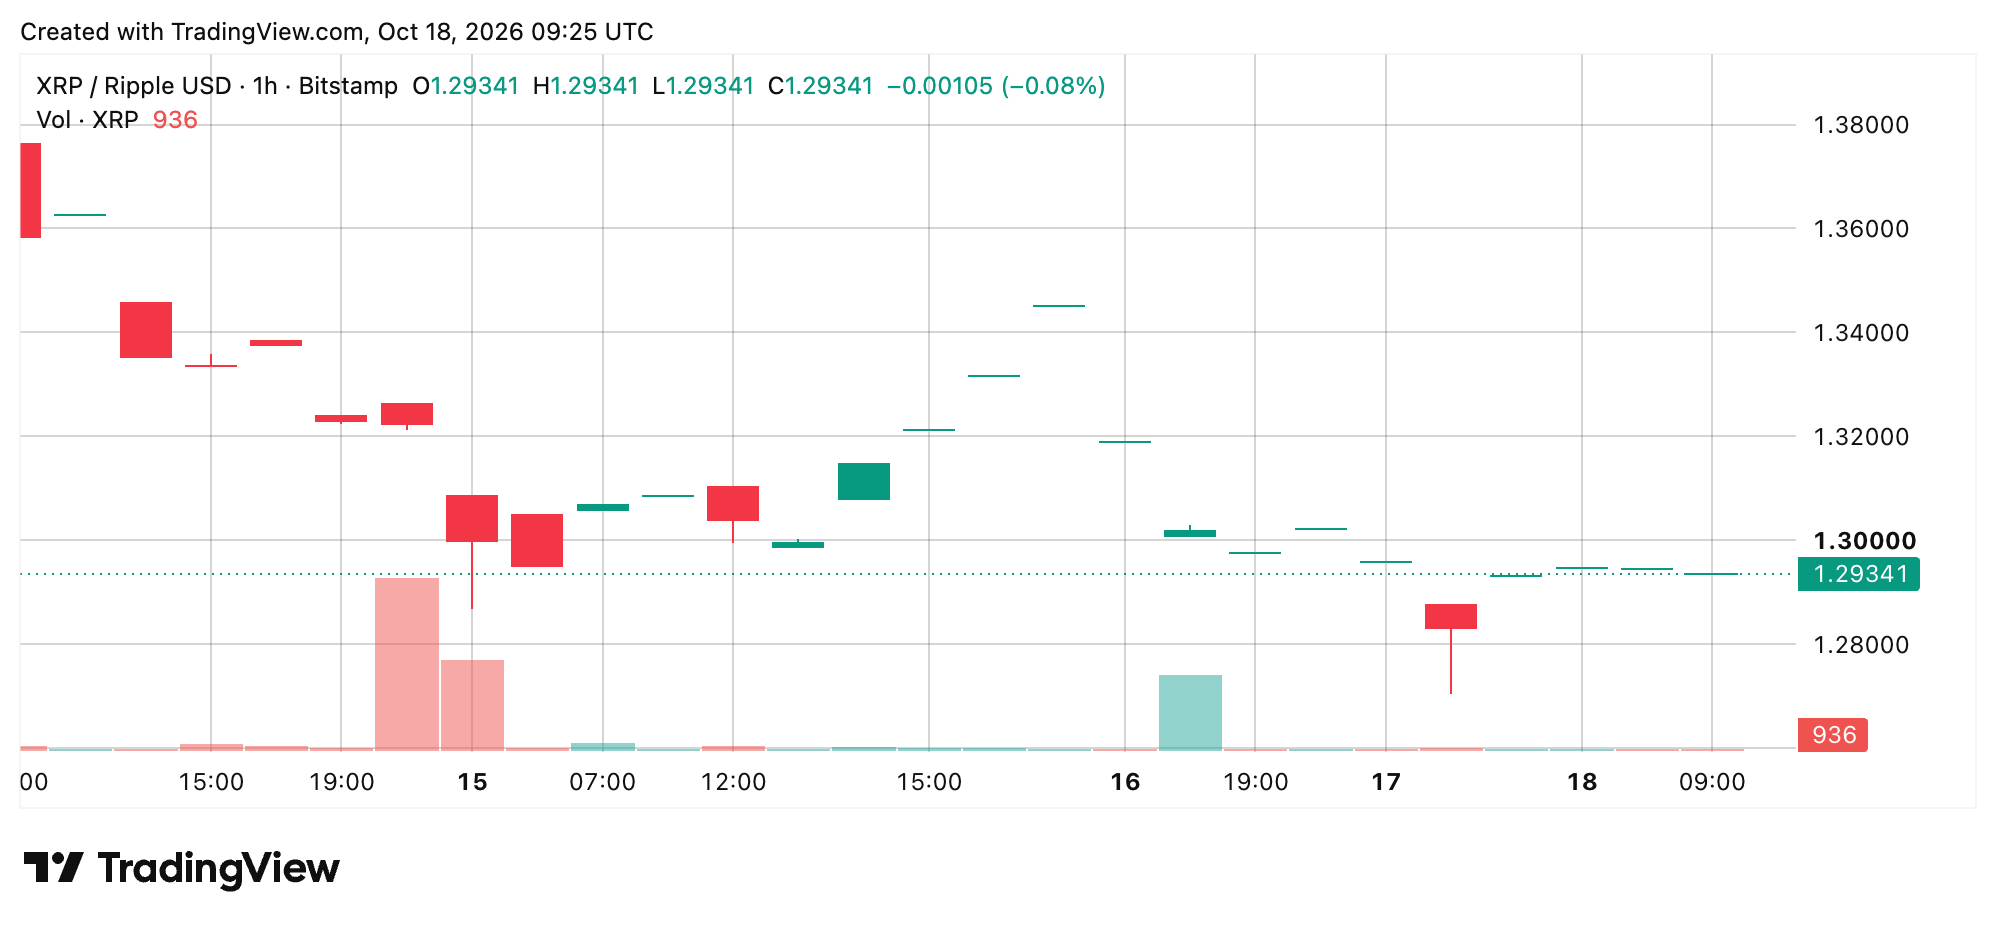
Those attempts have lacked the trading volume necessary to establish a sustained advance, leaving the immediate technical structure vulnerable. A confirmed move above $1.305, followed by $1.313, would improve the short-term outlook and potentially open the door toward $1.34. Conversely, a breakdown beneath $1.285 would put $1.27 back in play, testing whether buyers have enough conviction to defend the recent intraday floor.
Four-Hour Chart Keeps the Pressure on XRP Bulls
The four-hour chart tells a similar story, although the selling pressure becomes considerably clearer when viewed over a longer period. XRP has retreated from approximately $1.413 toward $1.29, producing a succession of lower highs and lower lows that continues to favor bearish positioning.
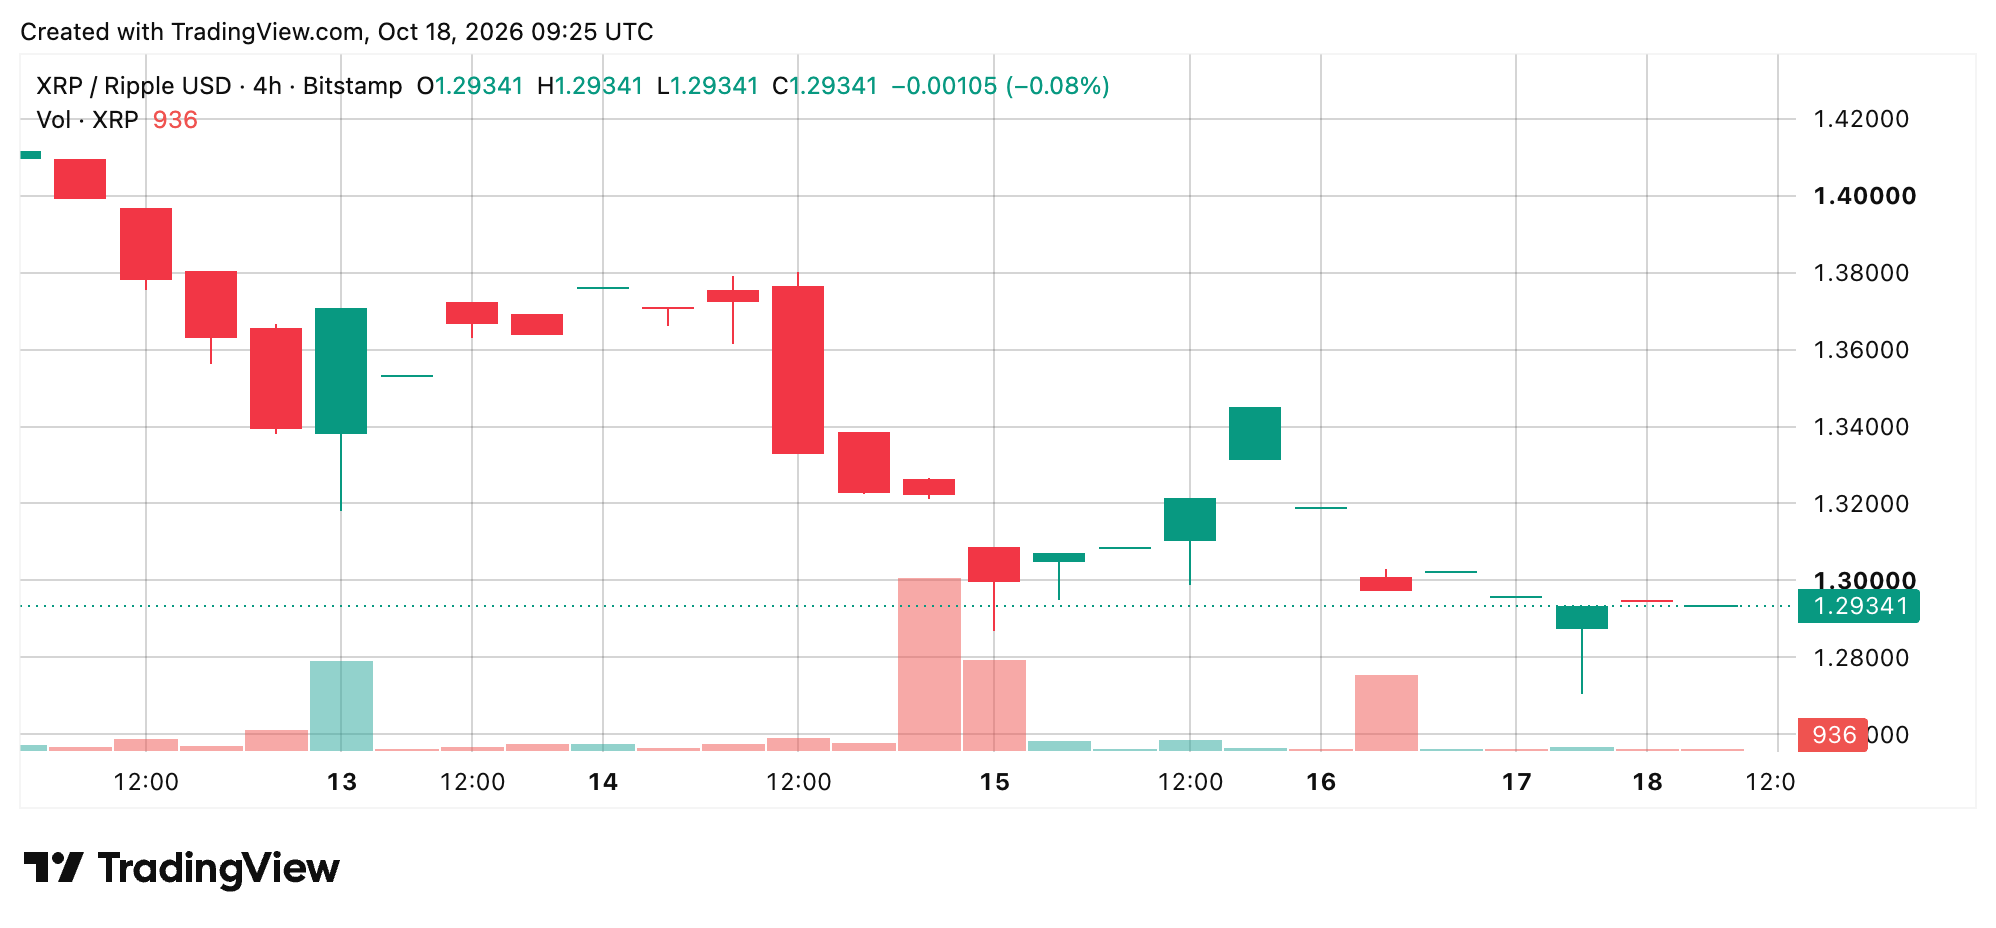
Rebounds have repeatedly encountered resistance beneath $1.35, with the $1.31 to $1.32 region presenting the first meaningful obstacle for buyers. Beyond that, the $1.34 to $1.35 area represents a more substantial recovery barrier. Trading volume has generally diminished during the latest consolidation, suggesting neither buyers nor sellers have demonstrated enough conviction to force a decisive breakout.
Daily Chart Reveals a More Troubling Technical Picture
Zooming out to the daily chart, XRP’s predicament becomes harder to dismiss. Following an earlier advance to $1.657, the cryptocurrency has surrendered a substantial portion of those gains, returning toward the lower boundary of its recent trading range. The $1.27 region represents the nearest significant support area, while $1.248 to $1.25 forms a deeper defensive zone that bulls would prefer not to revisit.
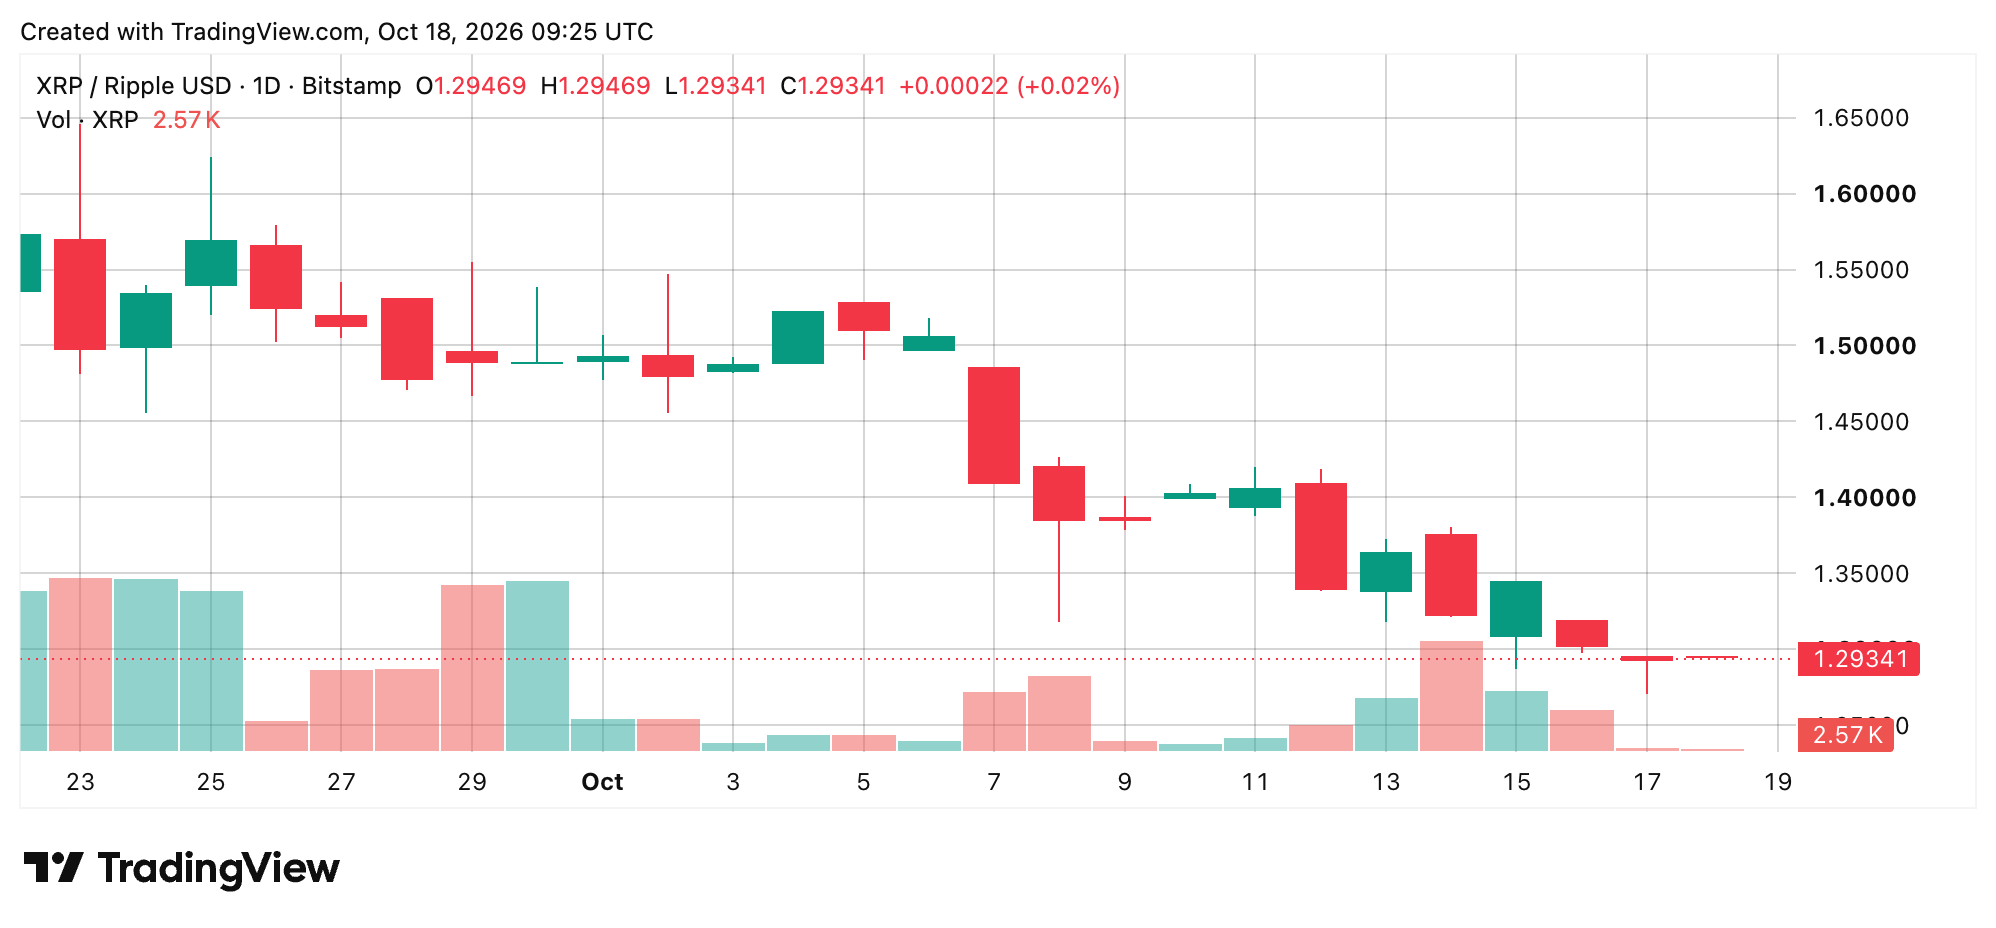
A sustained breakdown beneath that territory would further weaken the daily structure and raise questions about the durability of the preceding recovery. On the upside, reclaiming $1.40 to $1.42 would represent an important step toward reversing the current sequence of lower highs.
Oscillators Suggest XRP Is Getting Stretched to the Downside
Interestingly, XRP’s oscillator tape via the daily chart isn’t quite as pessimistic as its price charts. The relative strength index (RSI) stands at 34.65, while Stochastic registers 9.04 and Williams percent range sits at minus 91.85, readings consistent with a market approaching or occupying oversold territory. The commodity channel index (CCI) at minus 114.23 and momentum indicator at minus 0.087 produce positive signals in the supplied technical summary. However, moving average convergence divergence (MACD) remains negative at minus 0.036, indicating downward momentum hasn’t convincingly reversed. Of the 11 tracked oscillators, eight remain neutral, two register positive signals and one favors sellers.
Moving Averages Leave Little Room for Optimism
Moving averages (MAs), meanwhile, paint a considerably darker picture. XRP trades beneath its 10-period exponential moving average (EMA) at $1.3446, 20-period exponential moving average (EMA) at $1.3828 and 50-period simple moving average (SMA) at $1.4148. Eleven of the 15 tracked moving averages register negative signals, compared with three positive and one neutral.
There is, however, a small consolation for bulls. The 100-period simple moving average (SMA) at $1.2764 and 200-period simple moving average (SMA) at $1.2795 remain beneath the current price, creating a narrow area of potential technical support. Whether that support survives another round of selling is now the pressing question.
XRP Futures Open Interest Slips to $2.77 Billion as Leverage Cools
The derivatives market isn’t offering bulls much encouragement, either. XRP futures open interest stands at approximately $2.77 billion, representing roughly 2.14 billion XRP, after declining 1.32% over the preceding 24 hours. CME leads with $494.04 million in outstanding contracts, narrowly ahead of Binance at $491.05 million. Together, the two venues account for approximately 35.6% of the reported futures total.
The more revealing development involves leverage. The centralized exchange (CEX) Binance’s estimated leverage ratio has retreated toward 0.17 after approaching 0.23 in late September, suggesting speculative exposure is cooling as prices weaken. That’s an important distinction because declining open interest alongside falling prices can indicate traders are closing existing positions rather than aggressively establishing fresh bearish bets.
XRP Futures Market Snapshot
| Metric | Value |
|---|---|
| Total futures open interest | $2.77 billion |
| Open interest in XRP | 2.14 billion XRP |
| 24-hour open interest change | -1.32% |
| CME open interest | $494.04 million |
| Binance open interest | $491.05 million |
| Taker buy/sell ratio | 0.883 |
| Binance leverage ratio | 0.17 |
| Oct. 23 options max pain | $1.26 |
Source: Oct. 18, 2026, derivatives snapshot. The options max pain figure is included for market context.
In other words, XRP’s derivatives market appears to be working off some of its speculative excess. That doesn’t automatically signal a bullish reversal, but it can reduce the amount of leveraged positioning vulnerable to forced liquidation.
Aggressive selling nevertheless remains a persistent problem. The taker buy/sell ratio stands at 0.883, indicating that market participants executing immediate transactions are selling more aggressively than they’re buying. A sustained recovery above 1.0 would represent an early indication that buyers are beginning to regain control.
Options positioning adds another complication. The trading-volume put/call ratio recently climbed above 1.0, reflecting greater activity in bearish puts than bullish calls, although calls continue to dominate outstanding options contracts.
For the Oct. 23 expiration, the calculated max pain level sits at $1.26, approximately 2.6% beneath XRP’s indicated $1.293 price. Max pain represents the theoretical settlement level at which aggregate option holders would experience the greatest losses.
Polymarket Traders Give XRP a 50% Chance of Touching $1.20
Prediction markets are adding another fascinating dimension to XRP’s October predicament. On Polymarket, traders currently assign a 50% implied probability to XRP touching $1.20 before the month concludes, making it the highest-probability unresolved price target in the supplied market snapshot. The contract tracking XRP’s October price movements has generated approximately $272,430 in trading volume, with participants assigning a 44% chance to the cryptocurrency reaching $1.40. Expectations become considerably less optimistic at higher prices.
Polymarket’s XRP October Price Predictions
| XRP price target | Implied probability |
|---|---|
| $1.00 | 8% |
| $1.20 | 50% |
| $1.40 | 44% |
| $1.60 | 10% |
| $1.80 | 5% |
| $2.00 | 2% |
| $4.00 | Less than 1% |
Source: Oct. 18, 2026, market snapshot. Contracts measure whether XRP touches each target, not its month-end closing price.
A move to $1.60 carries just 10% implied probability, while reaching $1.80 stands at 5%. The chances of XRP touching $2 are priced at 2%, suggesting traders see relatively little likelihood of a dramatic upside recovery before November. On the downside, a decline to $1 carries 8% implied probability, while the chances of touching $0.80 stand at 2%. More extreme downside targets attract probabilities of 1% or less.
Perhaps the strangest figure appears at the opposite end of the spectrum. Polymarket’s $4 XRP contract has generated approximately $112,726 in trading volume, the largest individual figure among the listed targets, despite carrying less than 1% implied probability.
Kalshi’s XRP Predictions Show Fading Expectations for October
Kalshi traders appear similarly unconvinced that XRP is preparing for a dramatic comeback. The exchange’s October high-price market displays a forecast level of $1.50, down 20 cents, with approximately $61,729 in total trading volume. The market currently assigns a 16% implied probability to XRP climbing above $1.60 before the month ends. The chances of exceeding $1.70 stand at 14%, while reaching above $1.80 carries just 12%.
Kalshi’s XRP October Price Predictions
Kalshi’s October XRP high-price market shows weakening expectations for a meaningful recovery before the month ends. The market’s forecast level stands at $1.50, down 20 cents, with approximately $61,729 in trading volume.
| XRP price target | Implied probability | Reported decline |
|---|---|---|
| Above $1.60 | 16% | 49% |
| Above $1.70 | 14% | 57% |
| Above $1.80 | 12% | 85% |
Source: Oct. 18 market snapshot. Probabilities can change as trading continues.
Those contracts have also experienced substantial declines in their displayed probabilities, with the $1.60 threshold down 49%, the $1.70 threshold down 57% and the $1.80 threshold down 85% in the supplied market data.
| Bull Verdict | Bear Verdict |
|---|---|
| XRP’s defense of $1.27, combined with oversold oscillators and declining leverage, leaves room for a short-term recovery. A sustained breakout above $1.313, backed by stronger volume, could propel prices toward $1.34 to $1.35. Reclaiming $1.40 would strengthen the bullish case. | Sellers retain control beneath $1.31 to $1.35, with a breakdown below $1.285 exposing $1.27 and potentially $1.25. Weak futures demand, persistent selling pressure and Polymarket’s 50% odds of XRP touching $1.20 suggest further downside remains a credible threat. |