

Pi Network price has slipped toward $0.08 as its daily trend remains bearish and the 4-hour chart shows PI trading below its lower Bollinger Band.
Summary
- Pi Network price traded at $0.08006 on OKX, with the daily chart showing a 2.96% decline.
- The daily Supertrend remained above price at $0.09177, keeping its bearish signal in place.
- Aroon Down stood at 71.43%, compared with Aroon Up at 14.29% on the daily chart.
- PI fell below the lower 4-hour Bollinger Band at $0.08041, putting nearby support under pressure.
According to TradingView’s OKX PI/USDT daily chart, Pi traded at $0.08006 on Oct. 12 after reaching a session high of $0.08273 and a low of $0.07950. The token had recovered slightly from that low but remained below its daily opening price of $0.08253.
CoinGecko separately recorded an approximately 8% decline over seven days and a 16.4% loss over the past month. Its market comparison showed the broader cryptocurrency market falling 4.7% over the week, leaving PI with a larger decline over the same period.
Pi Network tests $0.08 after another failed rebound
The daily TradingView chart shows PI approaching the lower end of the range it has traded within since July. Several rebounds during August and September carried the token toward $0.10, but none developed into a sustained move above that area.
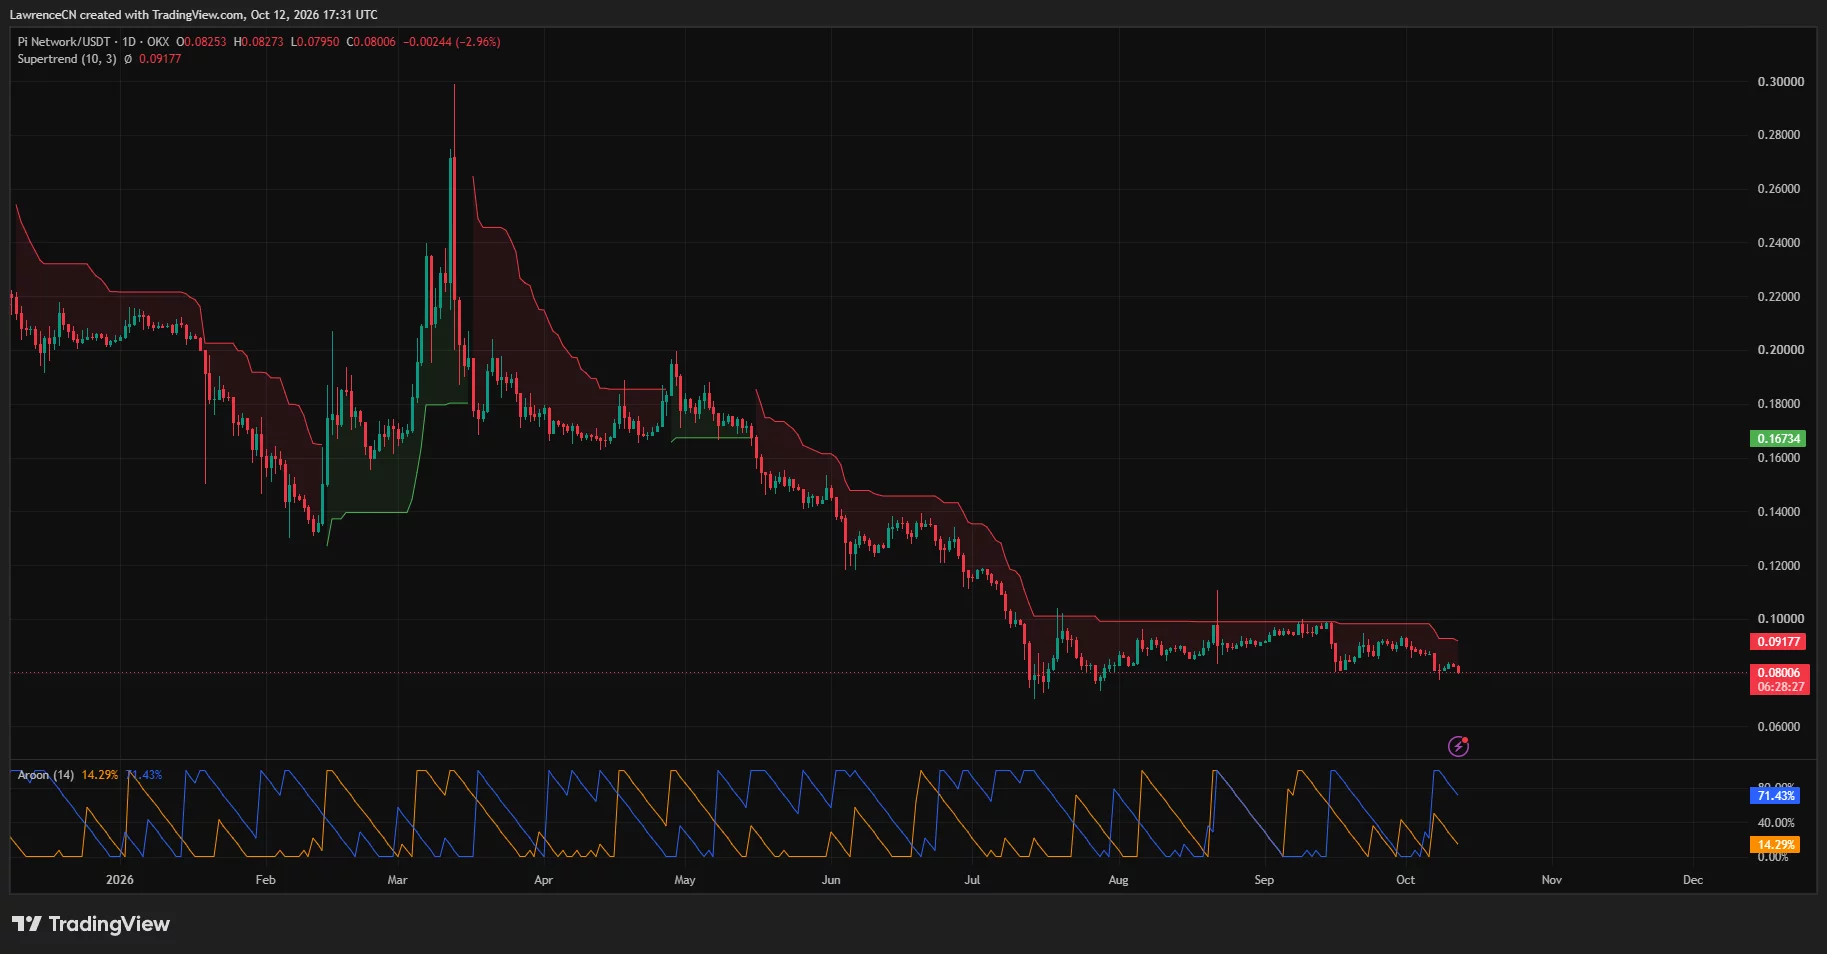
September’s advance ended with a sharp decline around the middle of the month. A subsequent recovery toward $0.09 also faded, leaving the latest candles close to $0.08.
On the 4-hour chart, the early October rebound peaked below September’s highs before price moved lower again. PI briefly steadied around $0.082–$0.083 following the latest sell-off, then returned toward the $0.08 threshold.
The daily session low of $0.07950 provides the nearest clearly defined reference below that threshold. A sustained move beneath it would extend the latest decline beyond the low recorded on Oct. 12.
Farther down, the TradingView charts show previous trading activity around $0.075 during July. That area forms a lower historical reference if PI loses its current footing, although the charts do not establish that price will reach it.
CoinGecko listed PI’s historical low at $0.07059. At the time of retrieval, the token remained about 13.3% above that level and approximately 97.3% below its historical high of $2.99.
Daily Supertrend keeps $0.09177 in focus
TradingView’s daily Supertrend remained red at $0.09177, well above PI’s $0.08006 price. The indicator has stayed above the market through the recent decline, maintaining its bearish reading.
PI would need to rise approximately 14.6% from the chart’s quoted price to reach that Supertrend level. Before reaching it, the token would also have to recover the nearby $0.083 area and move back toward $0.09.
The daily Aroon readings reinforce the weak trend. Aroon Down stood at 71.43%, while Aroon Up measured 14.29%, a gap of 57.14 percentage points.
Aroon tracks how recently an asset recorded its highest and lowest prices within the indicator’s lookback period. The stronger Down reading on PI’s chart reflects a more recent low, while the weak Up reading reflects the absence of a recent high.
Together, the daily indicators show that the latest rebound has not reversed the prevailing bearish setup. Price remains beneath the Supertrend, and the Aroon readings continue to favor the downward trend.
The September recovery toward $0.10 offers another resistance reference above the Supertrend. On the daily chart, that recovery failed close to the same area where earlier rebounds had stalled.
PI falls below its lower 4-hour Bollinger Band
TradingView’s 4-hour chart places the Bollinger Band midpoint at $0.08204, the upper band at $0.08367 and the lower band at $0.08041.
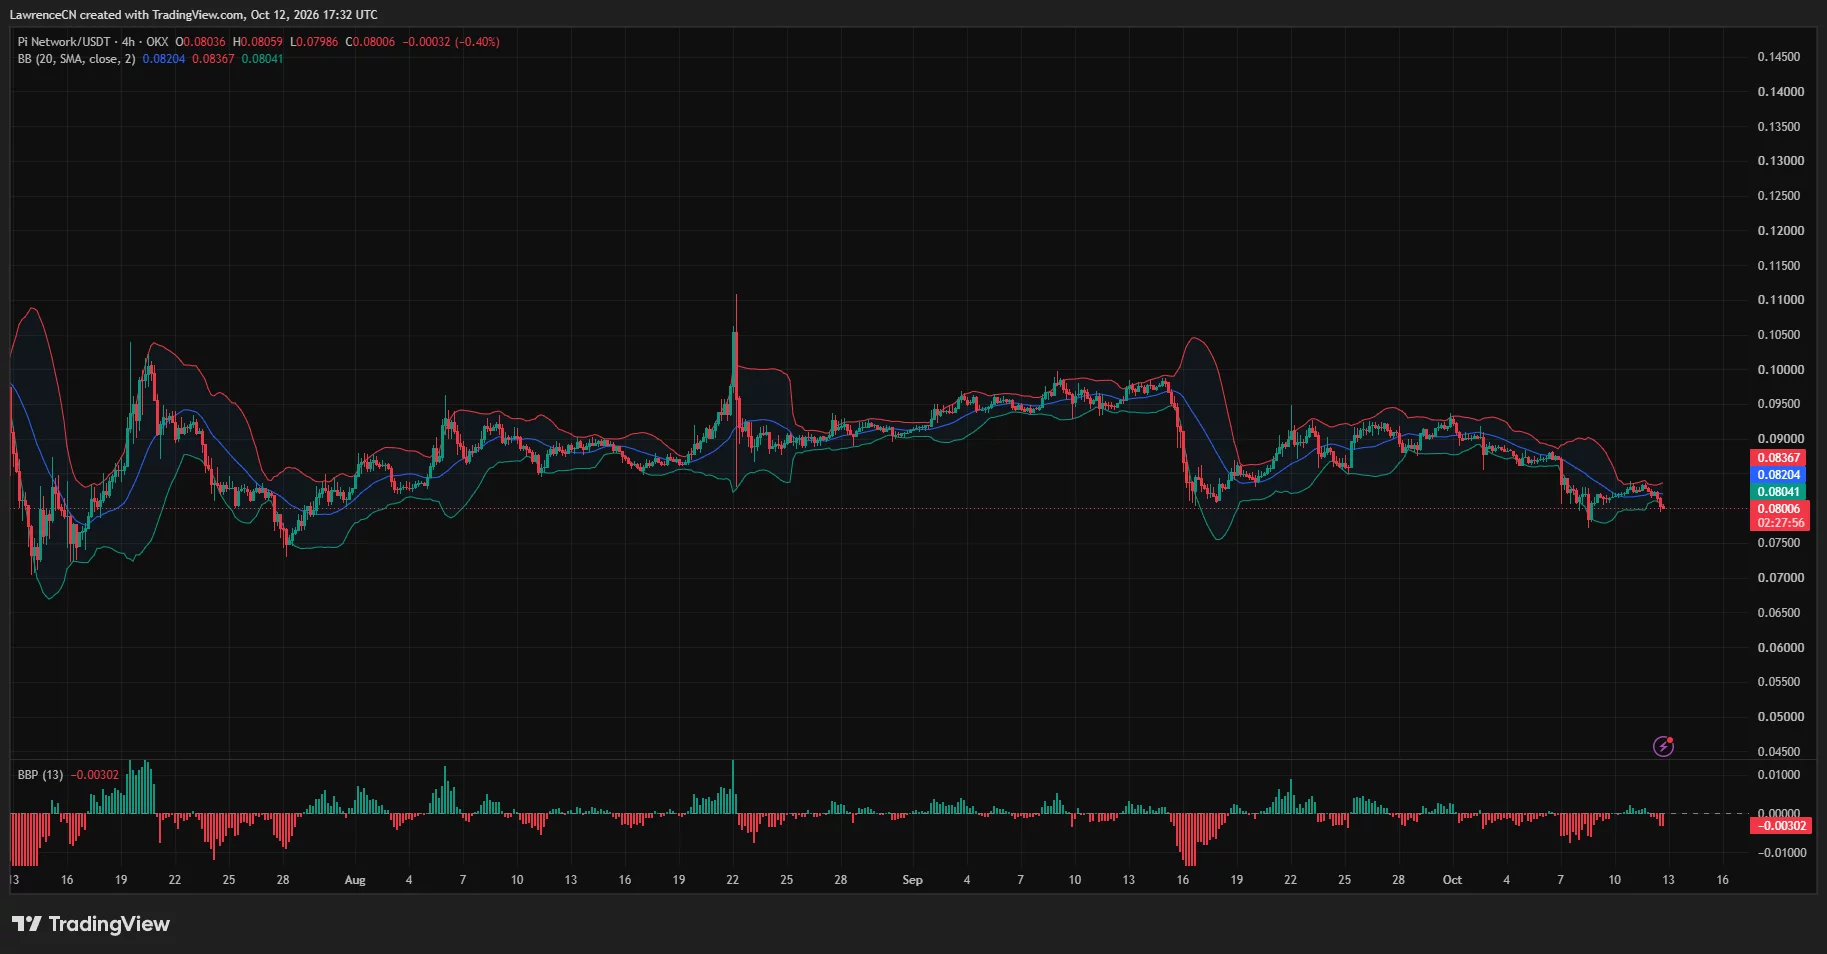
At $0.08006, PI traded approximately 0.4% below the lower band. Its position beneath that boundary shows price extending below the indicator’s recent trading envelope.
A return above $0.08041 would bring PI back inside the bands. The midpoint at $0.08204 would then provide the next nearby reference, about 2.5% above the chart’s quoted price.
The upper band at $0.08367 sits approximately 4.5% above $0.08006. Reaching it would require PI to recover the area where its latest attempt to stabilize lost momentum.
The same chart shows the Bull Bear Power indicator at minus 0.00302, with the latest histogram bars below zero. That negative reading adds to the weak short-term picture alongside price trading beneath the Bollinger midpoint.
An initial recovery above the lower band would therefore leave other hurdles in place. The midpoint, upper band and daily Supertrend sit at progressively higher levels, giving the rebound distinct tests rather than a single recovery threshold.
Market activity rises while PI remains under pressure
CoinGecko reported approximately $4.46 million in 24-hour trading volume, up 53.5% from the preceding day. The increase occurred alongside the price decline, showing that market activity had picked up even as PI lost ground. The provider placed its market capitalization near $899 million, with roughly 11.24 billion tokens circulating.
A separate Oct. 12 market report published by TMGM cited CoinAnk figures showing futures open interest falling from $10.52 million the previous week to $8.86 million. That represents a decline of approximately 15.8% in the reported value of outstanding positions.
For U.S. readers, PI also has a domestic project connection: CoinGecko identifies its founders as Stanford doctorate holders Nicolas Kokkalis and Chengdiao Fan and names SocialChain Inc. as the organization managing the project.
Pi Network’s official launch announcement set the Open Network transition for Feb. 20, 2025, enabling connections with external systems. The team also said user verification and mainnet migrations would continue after the transition.
On the current TradingView charts, the immediate price contest remains around $0.08 and the $0.07950 session low. A rebound would first encounter the lower Bollinger Band at $0.08041, followed by its midpoint at $0.08204, while the daily Supertrend remains farther above at $0.09177.
Disclosure: This article does not represent investment advice. The content and materials featured on this page are for educational purposes only.