

Starknet price rebounded nearly 25% toward $0.096 on Oct. 15 as voting opened on research into an independent blockchain, although STRK remained about 22% lower for the week.
Summary
- Starknet price recovered from a daily low of $0.0718 but remained below the $0.10 threshold.
- Starknet opened a seven-day, nonbinding poll on researching an independent, quantum-resistant layer-1 network.
- The daily chart placed nearby resistance at $0.0977, followed by the $0.1221 range boundary.
- CoinGlass showed concentrated liquidation levels below price around $0.065–$0.070, alongside overhead bands near $0.10.
TradingView’s Binance STRK/USDT daily chart showed the token trading at $0.09607, up 24.78% from the session’s opening price of $0.077. The rebound followed a drop to $0.0718, while the day’s high reached $0.09874.
The recovery brought STRK back toward $0.10 after several days of losses. TradingView’s weekly chart still showed a decline of approximately 22.4%, with the token trading below its weekly opening level of $0.12311.
Starknet’s rebound meets resistance below $0.10
TradingView’s daily Murrey Math indicator placed STRK just below a support-and-resistance pivot at $0.09766. The session’s high briefly exceeded that level, but the price had returned below it at the chart’s timestamp.
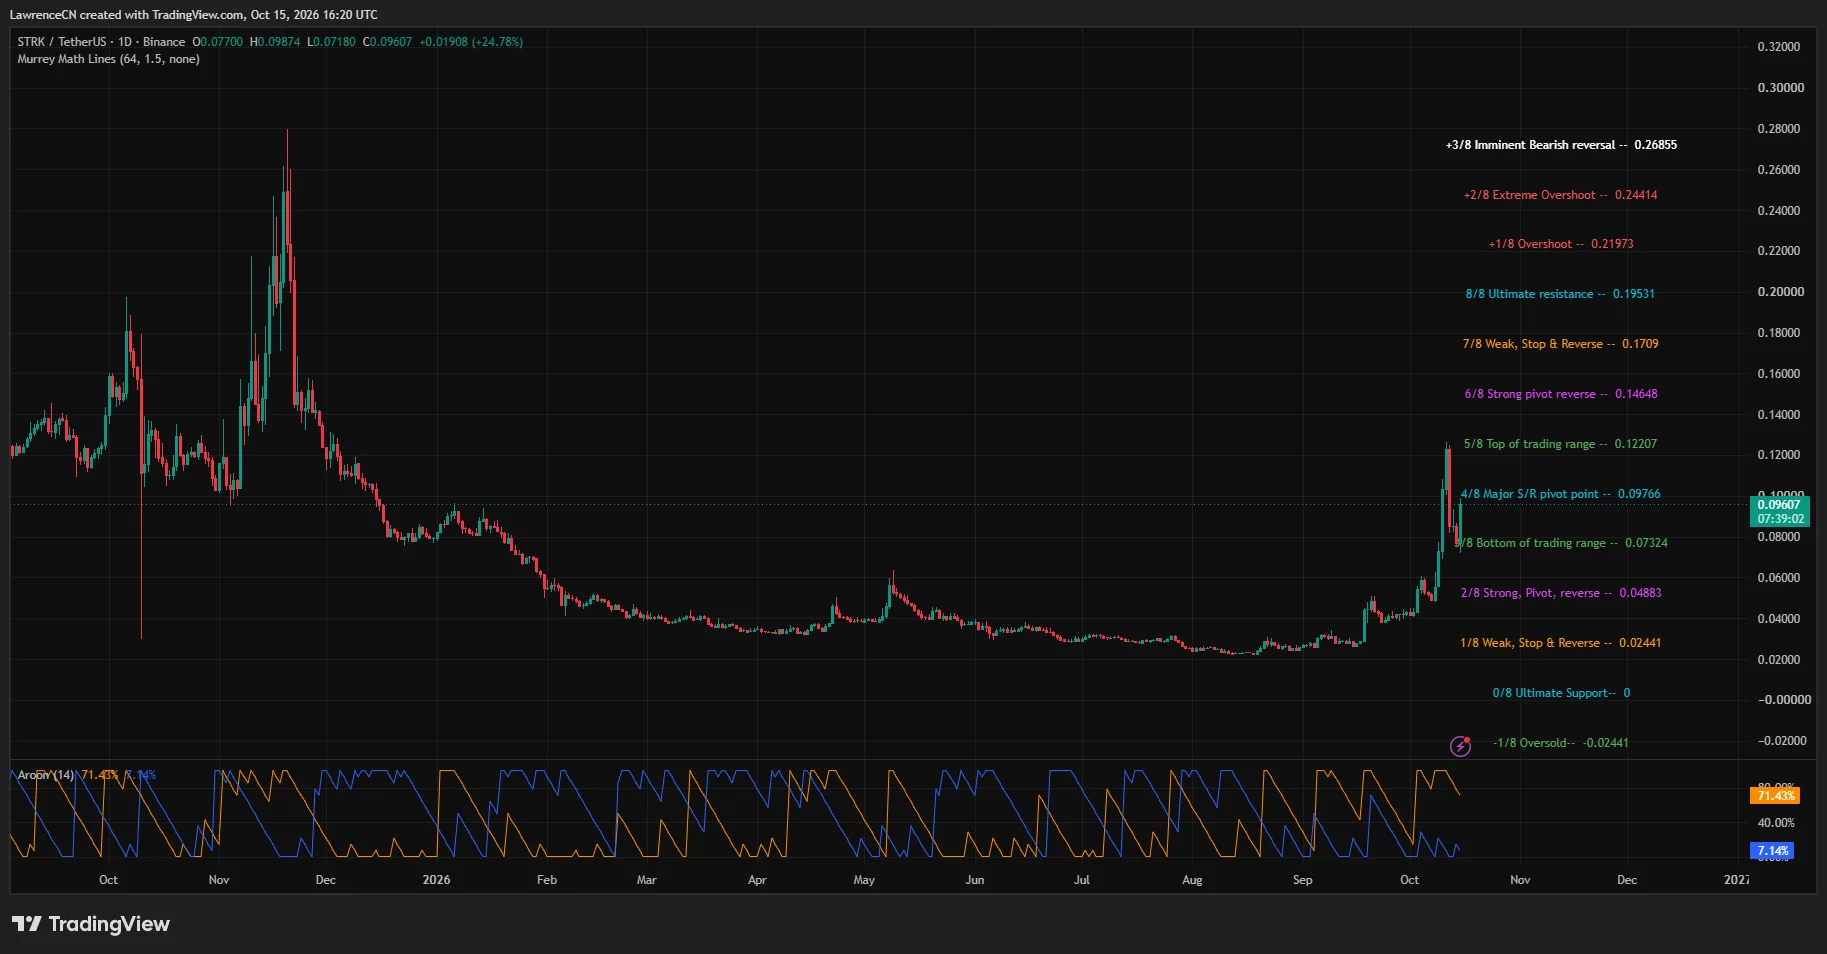
A sustained move above $0.09766 would put the nearby $0.10 threshold back in focus. Beyond that, the indicator’s next marked boundary stood at $0.12207, close to the area where the recent rally reversed.
From approximately $0.096, reaching $0.12207 would require another gain of about 27%. That upper boundary also sits near the weekly high of $0.12494, leaving a clear gap between the current rebound and a full recovery of the week’s losses.
On the downside, the daily indicator marked the bottom of its trading range at $0.07324. STRK briefly traded below that boundary when it reached $0.0718, before recovering above it.
Those two levels form the nearest lower reference zone on the daily chart. Beneath them, the next Murrey Math pivot stood at $0.04883, substantially below the current trading price.
The daily Aroon indicator showed its upward reading at 71.43% and its downward reading at 7.14%. The upward reading remained dominant despite the pullback from the recent peak, although it had retreated from its maximum level.
The governance vote concerns research into an independent network
Starknet’s governance forum said the seven-day poll would gauge holders’ interest in exploring an independent, post-quantum layer-1 blockchain.
According to the proposal, approval would begin a research effort leading to more detailed proposals and polls. A rejection would leave the network pursuing its post-quantum work as an Ethereum layer-2.
The forum identified Ethereum-dependent components, including Starknet’s bridge and data availability, as the reason for considering independence. Its proposal said those components remain tied to Ethereum’s security timeline.
The proposal also stated that STRK would remain the network’s token and that Ethereum bridges would stay open under either path. It gave no timeline for an independent network.
Market commentator Route 2 FI linked STRK’s initial rise to news of the vote in an Oct. 15 post. The commentator reported approximately 99.8% support at that point, while stressing that a favorable result would support research rather than approve a transition.
That distinction separates the confirmed governance development from claims that Starknet has already decided to leave Ethereum.
Weekly momentum remains positive despite the price retreat
TradingView’s weekly MACD showed the MACD line at approximately 0.00689, above its signal line at minus 0.00362. The histogram remained positive at about 0.01052.
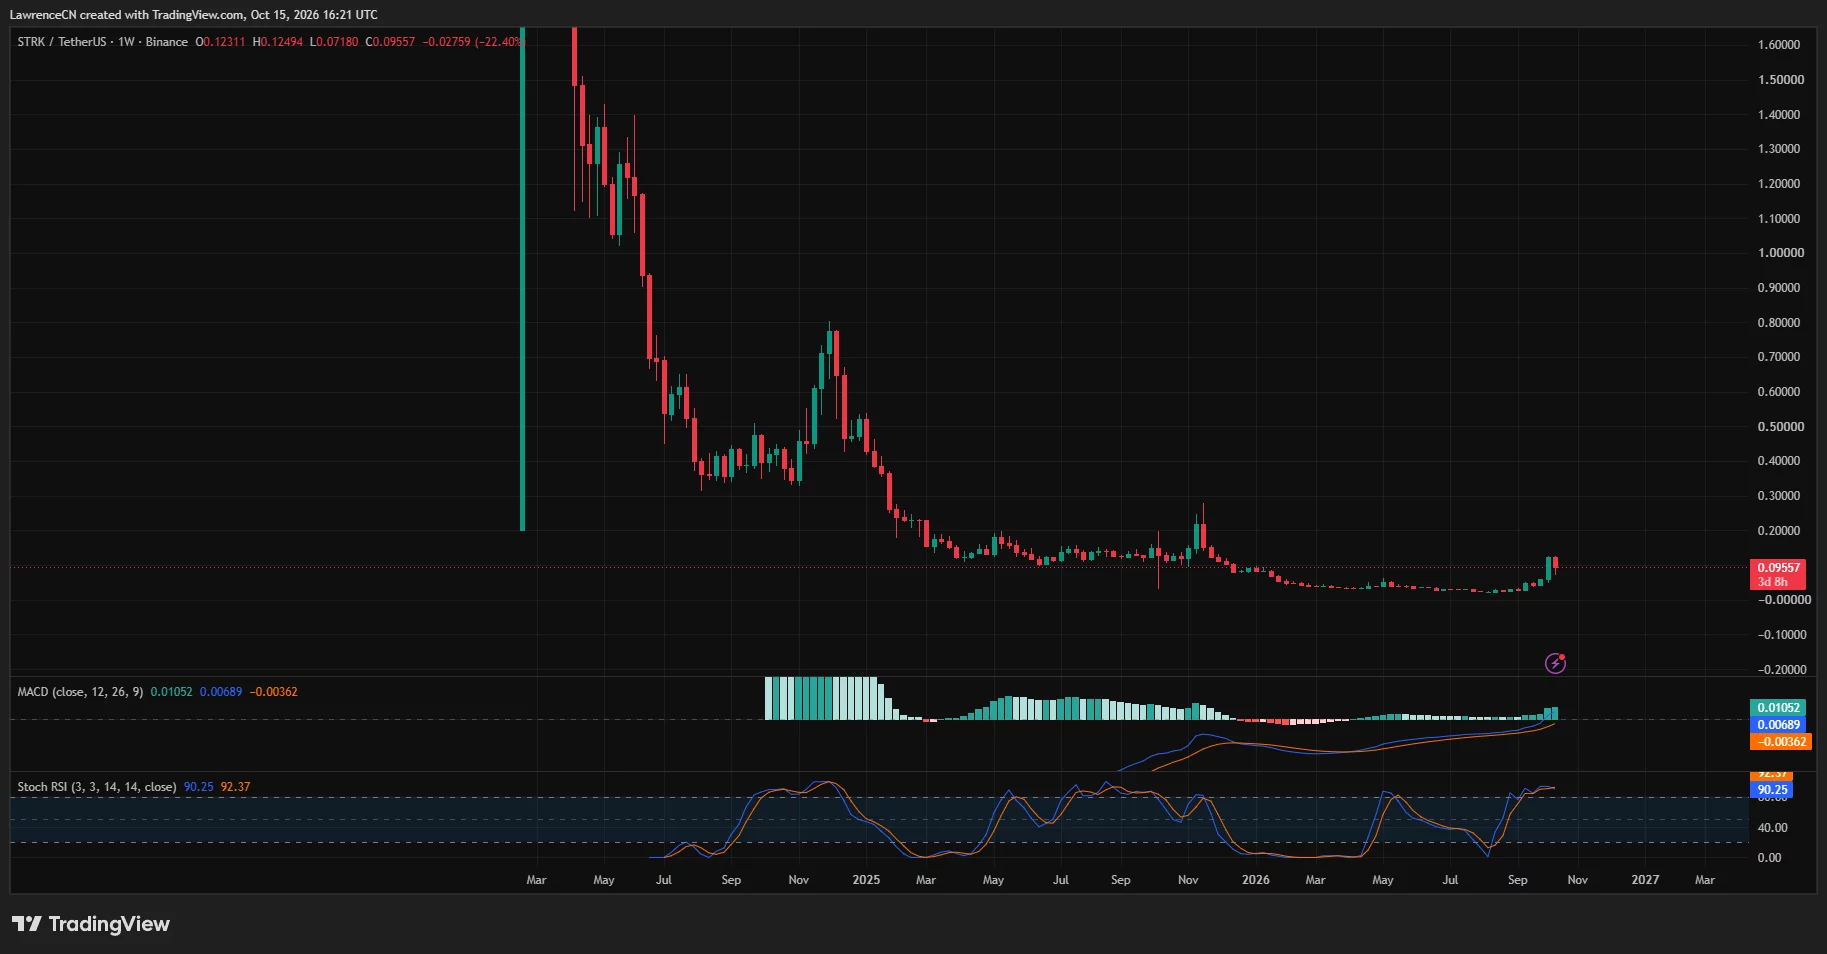
Those readings contrasted with the weekly price decline: STRK had surrendered part of its recent advance while the MACD retained its bullish crossover.
The weekly Stochastic RSI presented a more stretched picture. Its two readings stood near 90.25 and 92.37, both above the indicator’s conventional 80 threshold.
The faster line was slightly below the slower line, leaving a mixed weekly setup alongside the positive MACD. Price had rebounded sharply from the weekly low, but remained well below the opening level and recent high.
The longer weekly chart also showed STRK trading below earlier peaks near $0.20 and above. Even after its October advance, the token had recovered only part of the decline visible across the broader chart.
Liquidation bands and token releases frame the next test
CoinGlass’s one-month liquidation heatmap showed several overhead bands between approximately $0.094 and $0.10, followed by additional bands around $0.107–$0.11.
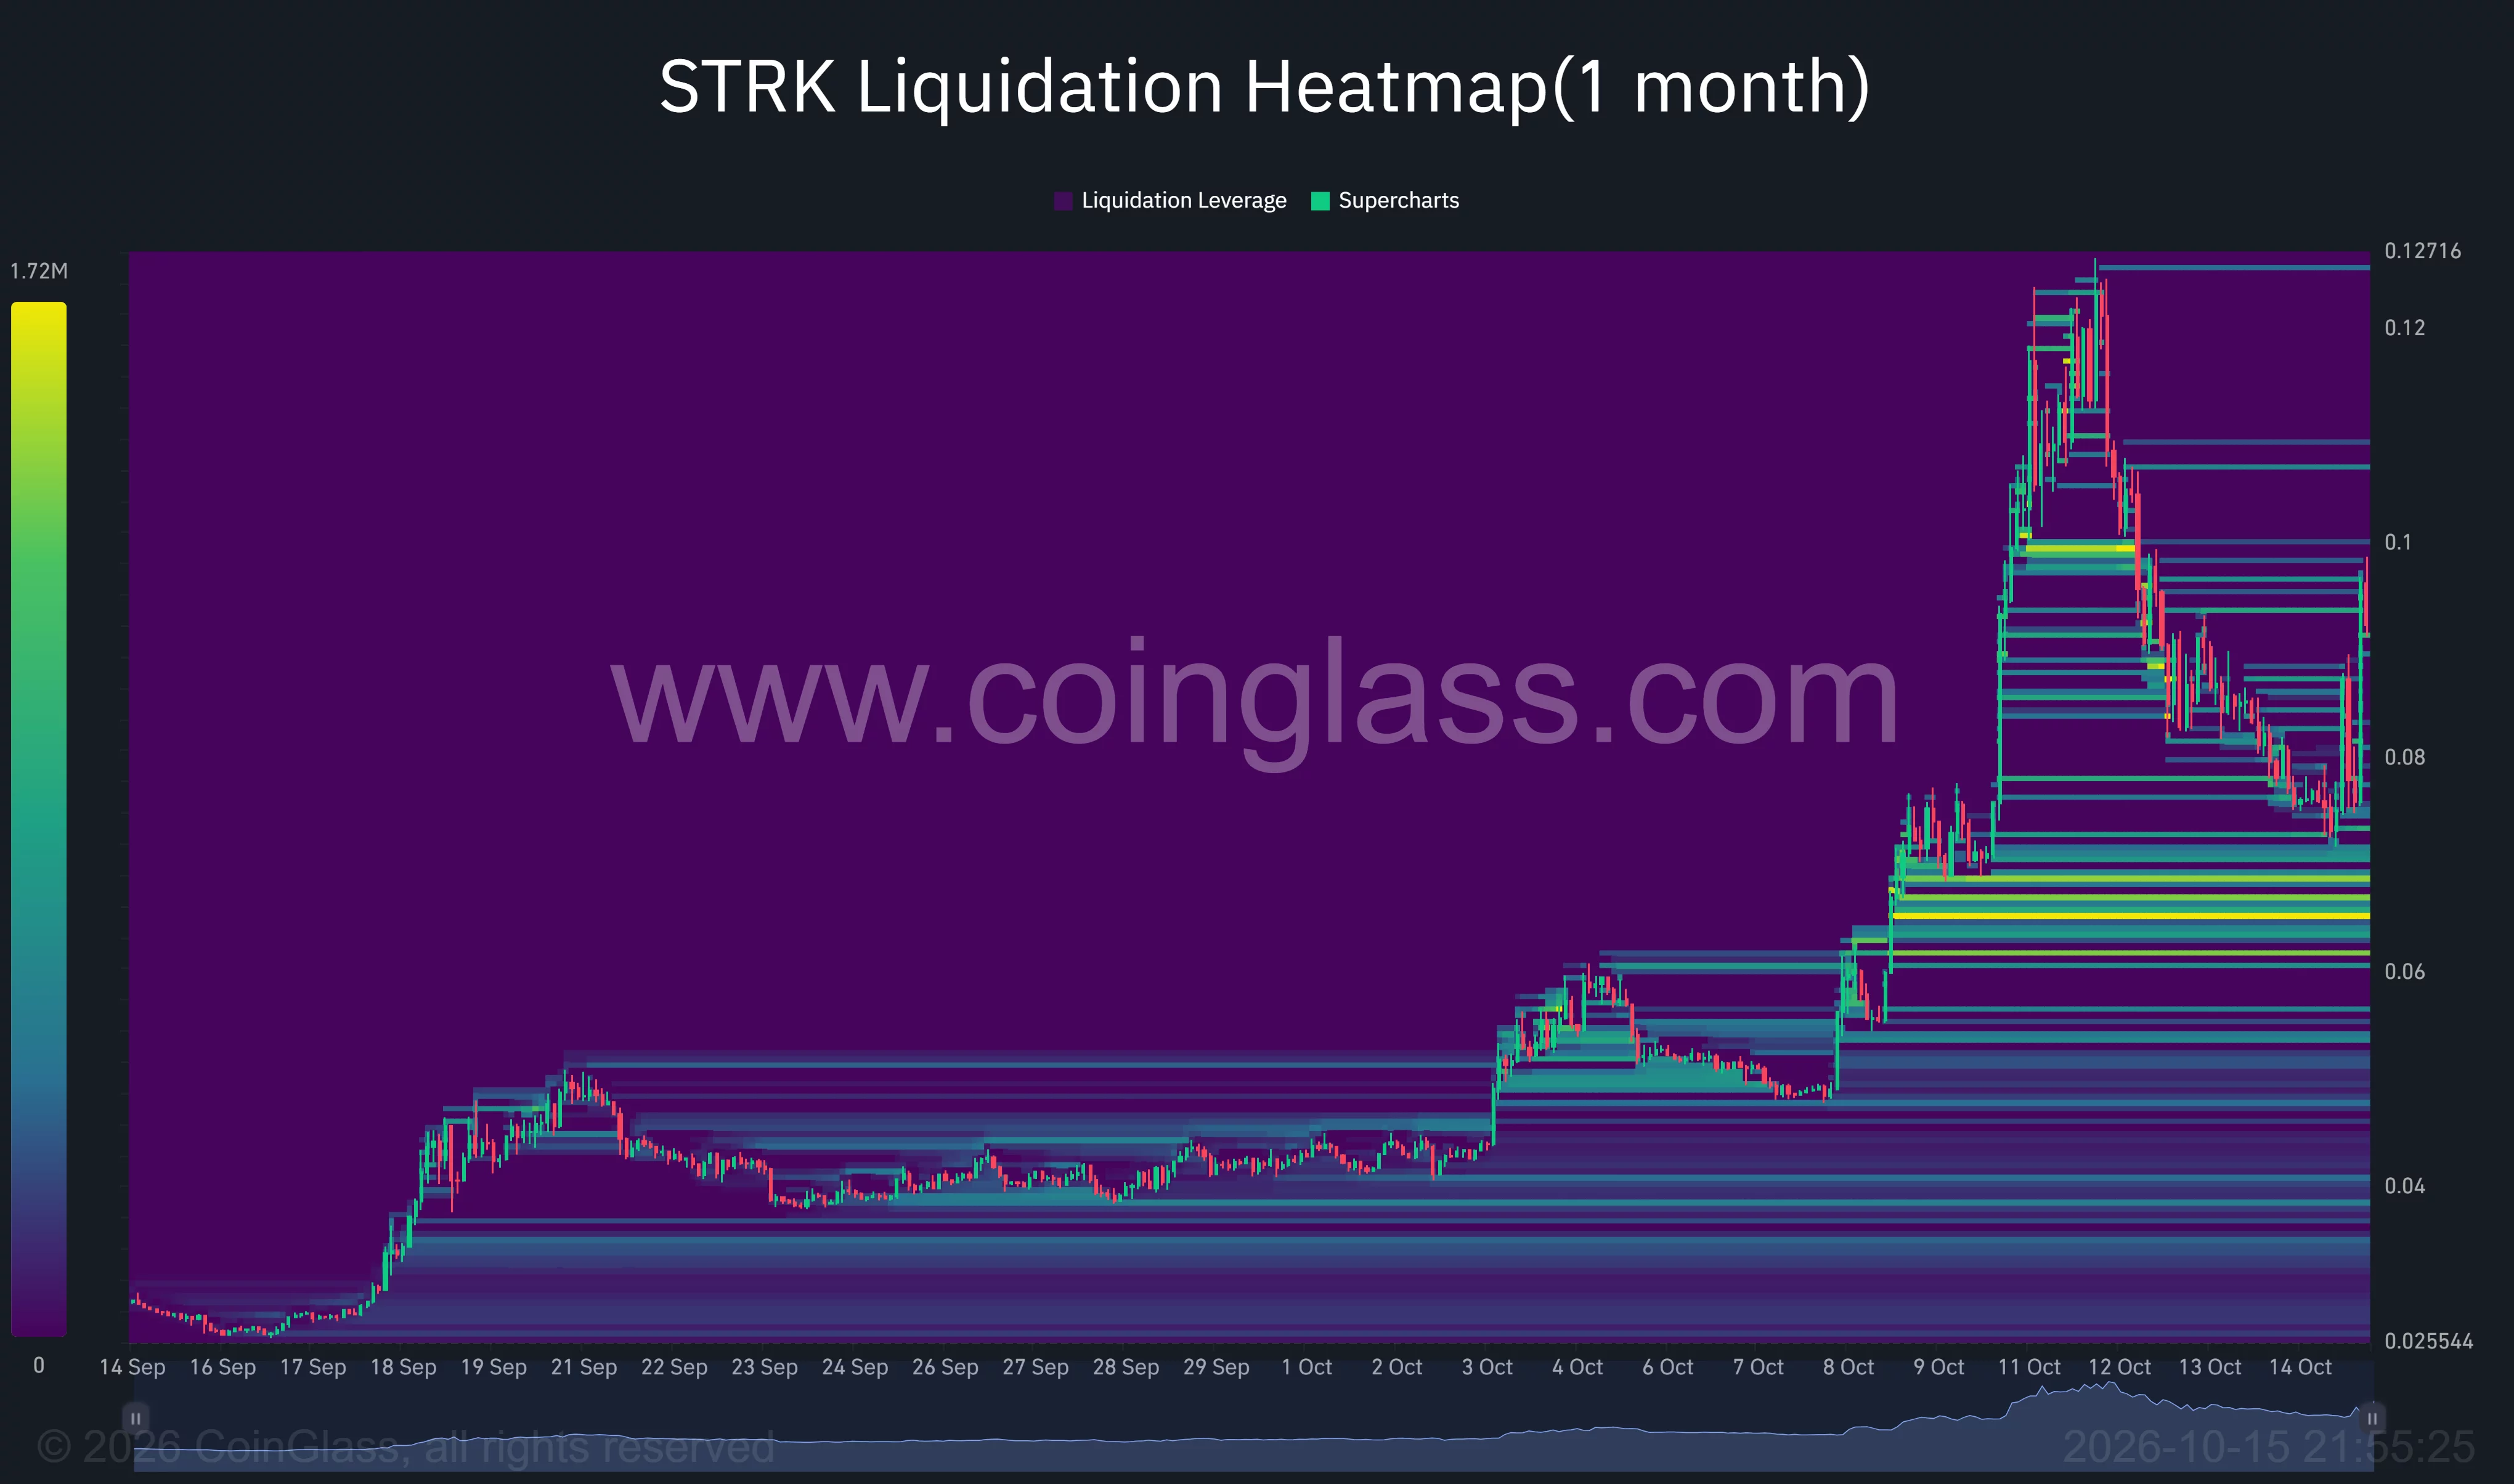
Below price, brighter concentrations appeared around $0.065–$0.070. Additional bands sat near $0.075–$0.08, placing leveraged positions on both sides of the rebound.
Meanwhile, Starknet’s documentation states that up to 127 million tokens allocated to investors and early contributors unlock on the 15th of each month through March 2027.
At approximately $0.096 per token, that scheduled tranche represents roughly $12.2 million. The documentation also identifies STRK’s uses as transaction fees, staking, and governance.
For U.S. holders following the governance debate, the official documentation specifies that STRK does not represent equity in StarkWare or the Starknet Foundation.
On the price chart, $0.09766 and $0.10 remain the immediate recovery tests. A move above both would bring $0.12207 into view, while a reversal would return attention to $0.07324 and the $0.0718 weekly low.
Disclosure: This article does not represent investment advice. The content and materials featured on this page are for educational purposes only.