

Key Takeaways
- Bitcoin’s price traded near $82,816 on Oct. 10, holding its range as bulls defended support around $82,200.
- Bitcoin’s technical indicators remain mixed, with neutral momentum but stronger longer-term moving averages.
- Bitcoin bulls need to reclaim $83,432 to $84,400, while losing $82,200 would put lower support levels in play.
Bitcoin’s $82,800 Standoff Leaves Bulls Facing a $84,400 Wall
Bitcoin’s price spent Saturday morning hovering around $82,800, caught between an improving short-term recovery and stubborn resistance that continues to frustrate bulls. At approximately 7:52 a.m. Eastern time on Oct. 10, bitcoin traded at $82,816.39, with a market capitalization of $1.664 trillion and $21.33 billion in 24-hour trading volume.
The leading crypto asset changed hands between $82,229.11 and $83,315 during the preceding 24 hours, leaving traders watching whether the latest consolidation represents a foundation for another advance or merely a temporary reprieve following the week’s retreat.
Hourly Chart Shows Improving Momentum
The one-hour chart offers the most encouraging signs for bulls, with bitcoin’s price recovering from a recent low of $81,546 and establishing a series of higher lows. Price action around $82,800 suggests bulls are attempting to maintain their footing, although resistance between $83,000 and $83,432 continues to complicate matters.
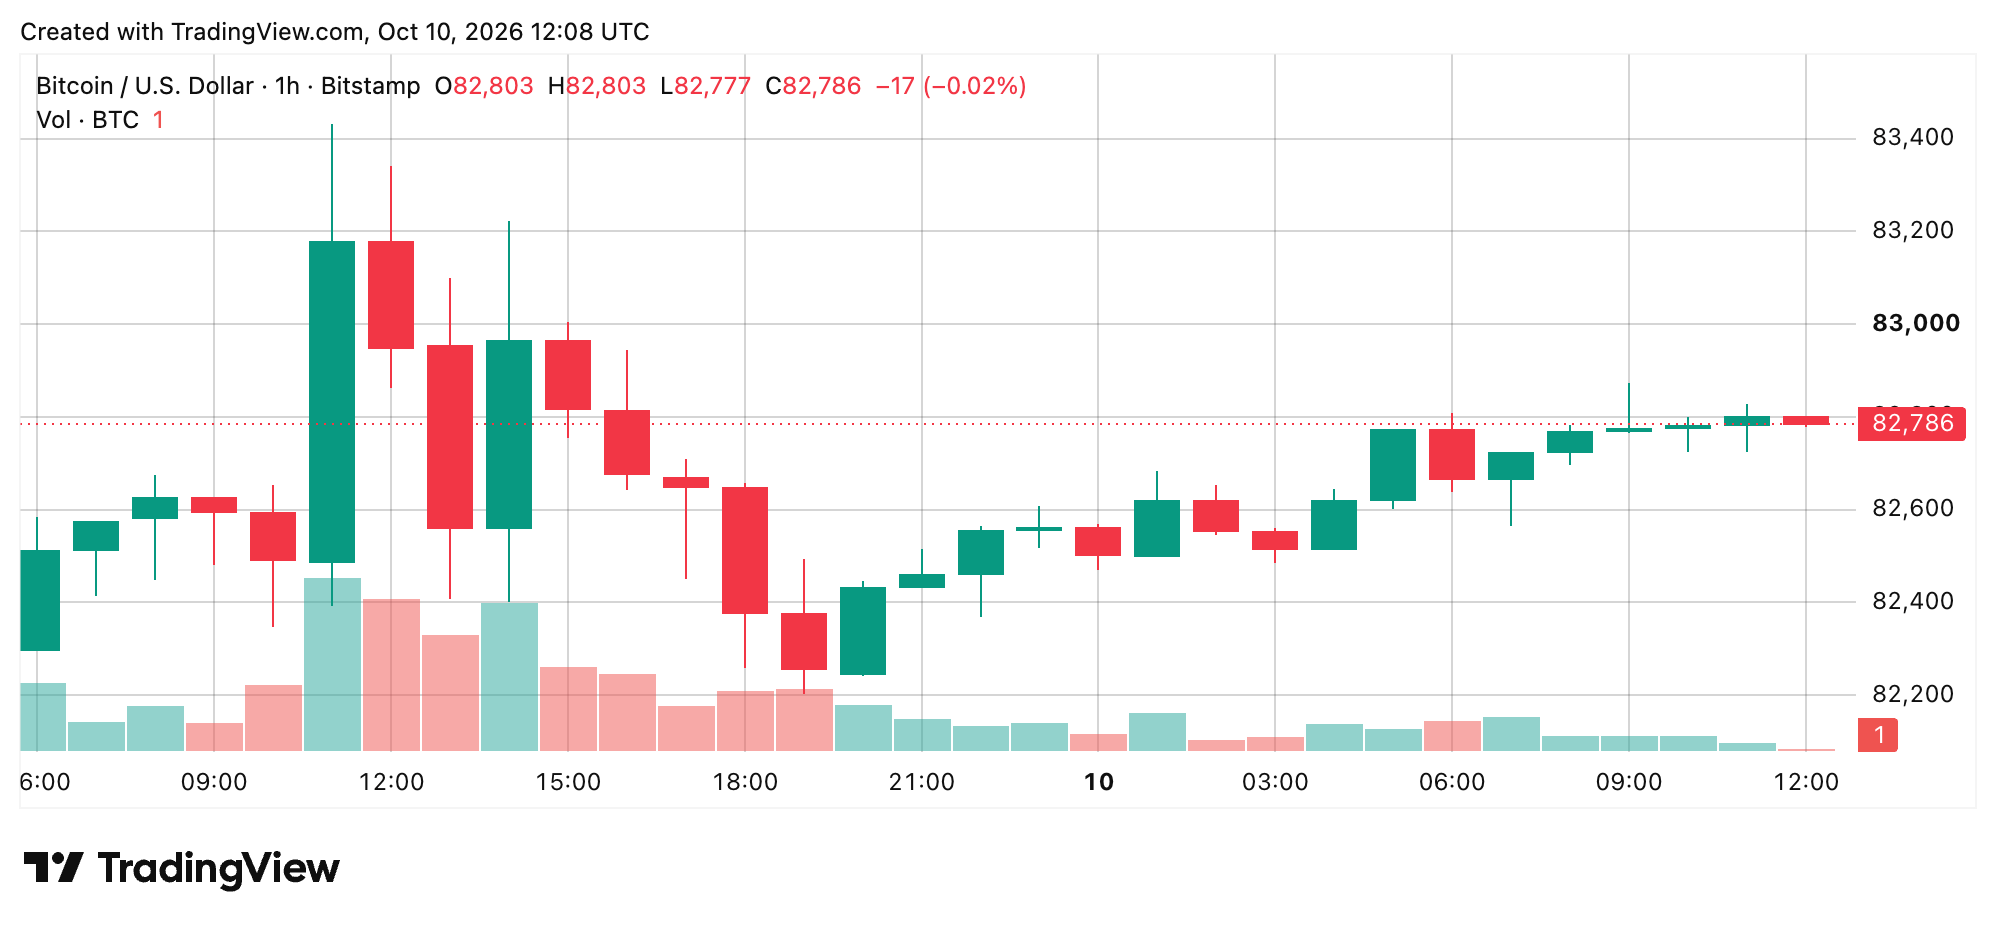
A sustained break above $83,432 would bring $84,000 into focus, while a retreat below $82,400 could send the market back toward $82,200. Trading volume has softened during the recovery, leaving questions about whether bullish momentum has enough strength to carry prices higher.
4 Hour Chart Highlights Restraint
The four-hour chart tells a more restrained story, as bitcoin’s price range continues consolidating after its decline from $86,969 to $80,308. Although bulls have managed to recover some lost ground, repeated difficulty clearing the $83,300 to $83,400 region suggests bearish pressure hasn’t disappeared.
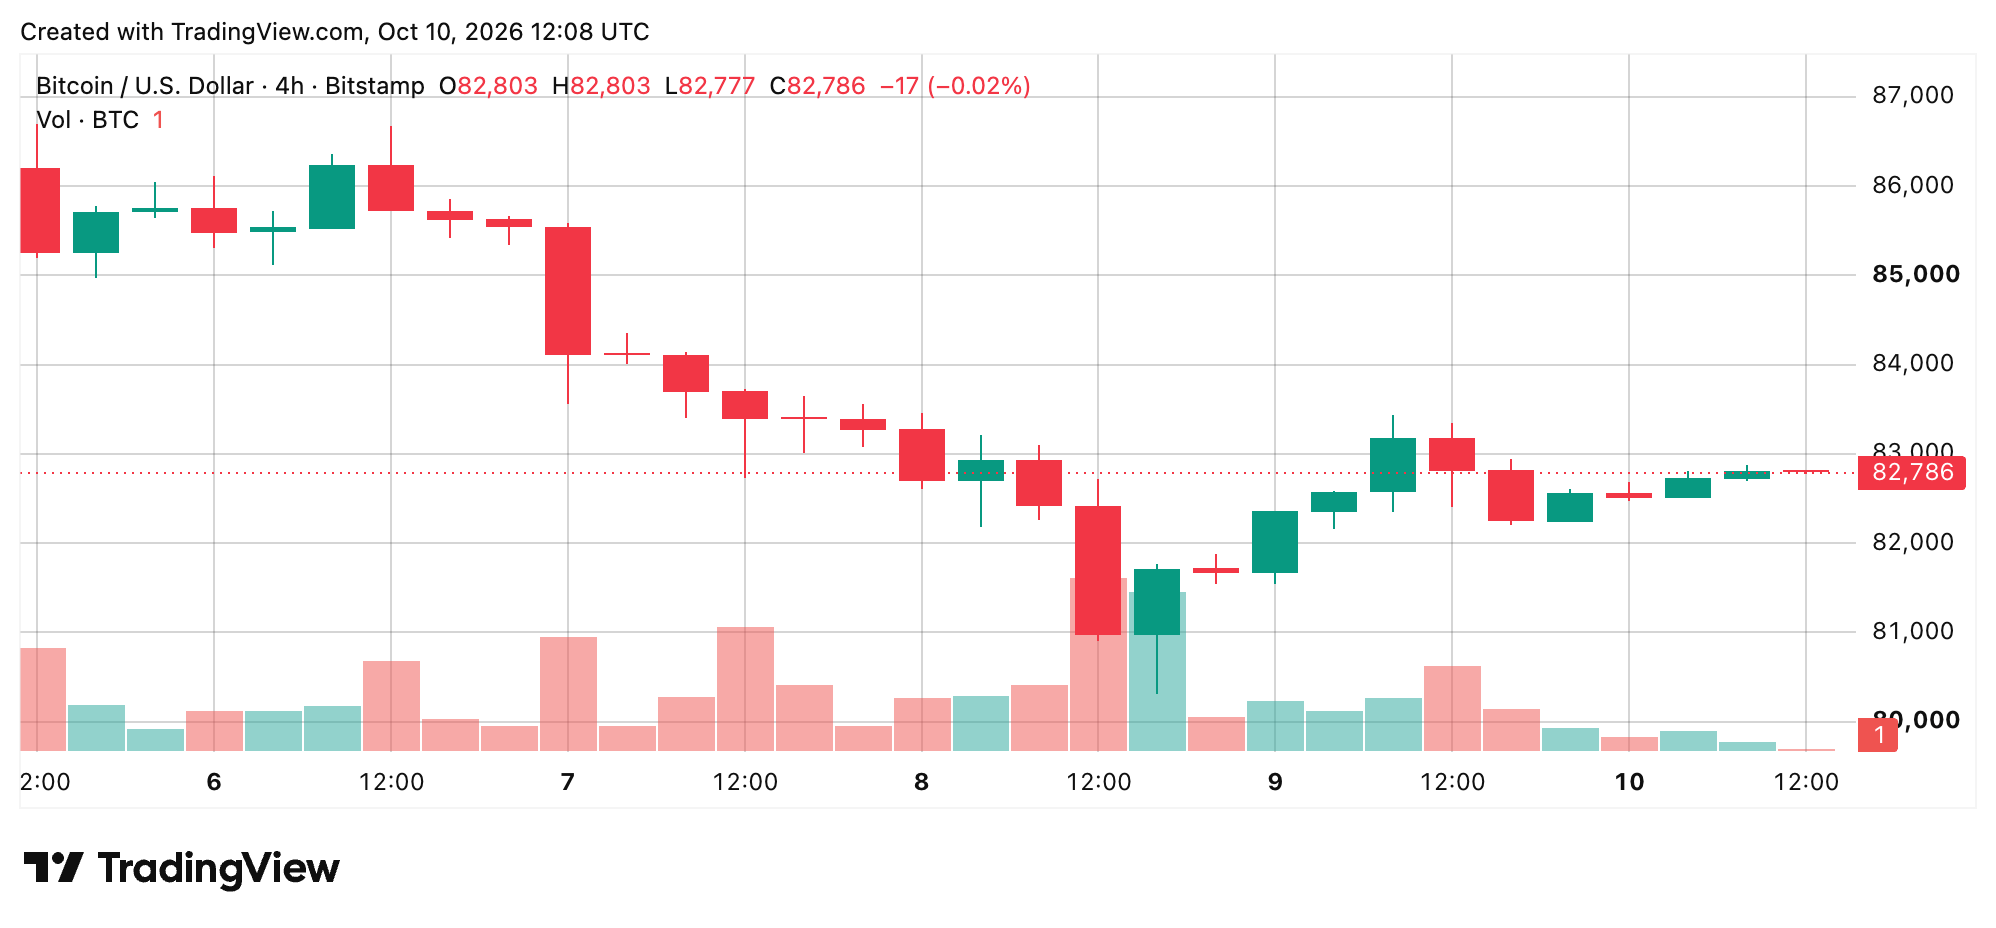
Support around $81,700 provides an important cushion, with $80,308 representing a deeper defensive level. For now, the market appears trapped between recovering demand and overhead resistance, with neither side demonstrating enough conviction to establish a decisive directional move.
Daily Chart Maintains Range-Bound Structure
The daily chart reinforces the consolidation narrative, showing bitcoin’s price attempting to establish stability following its correction from $87,374. Despite the pullback, the cryptocurrency continues trading above several longer-term moving averages, suggesting the broader technical structure hasn’t suffered a decisive breakdown.
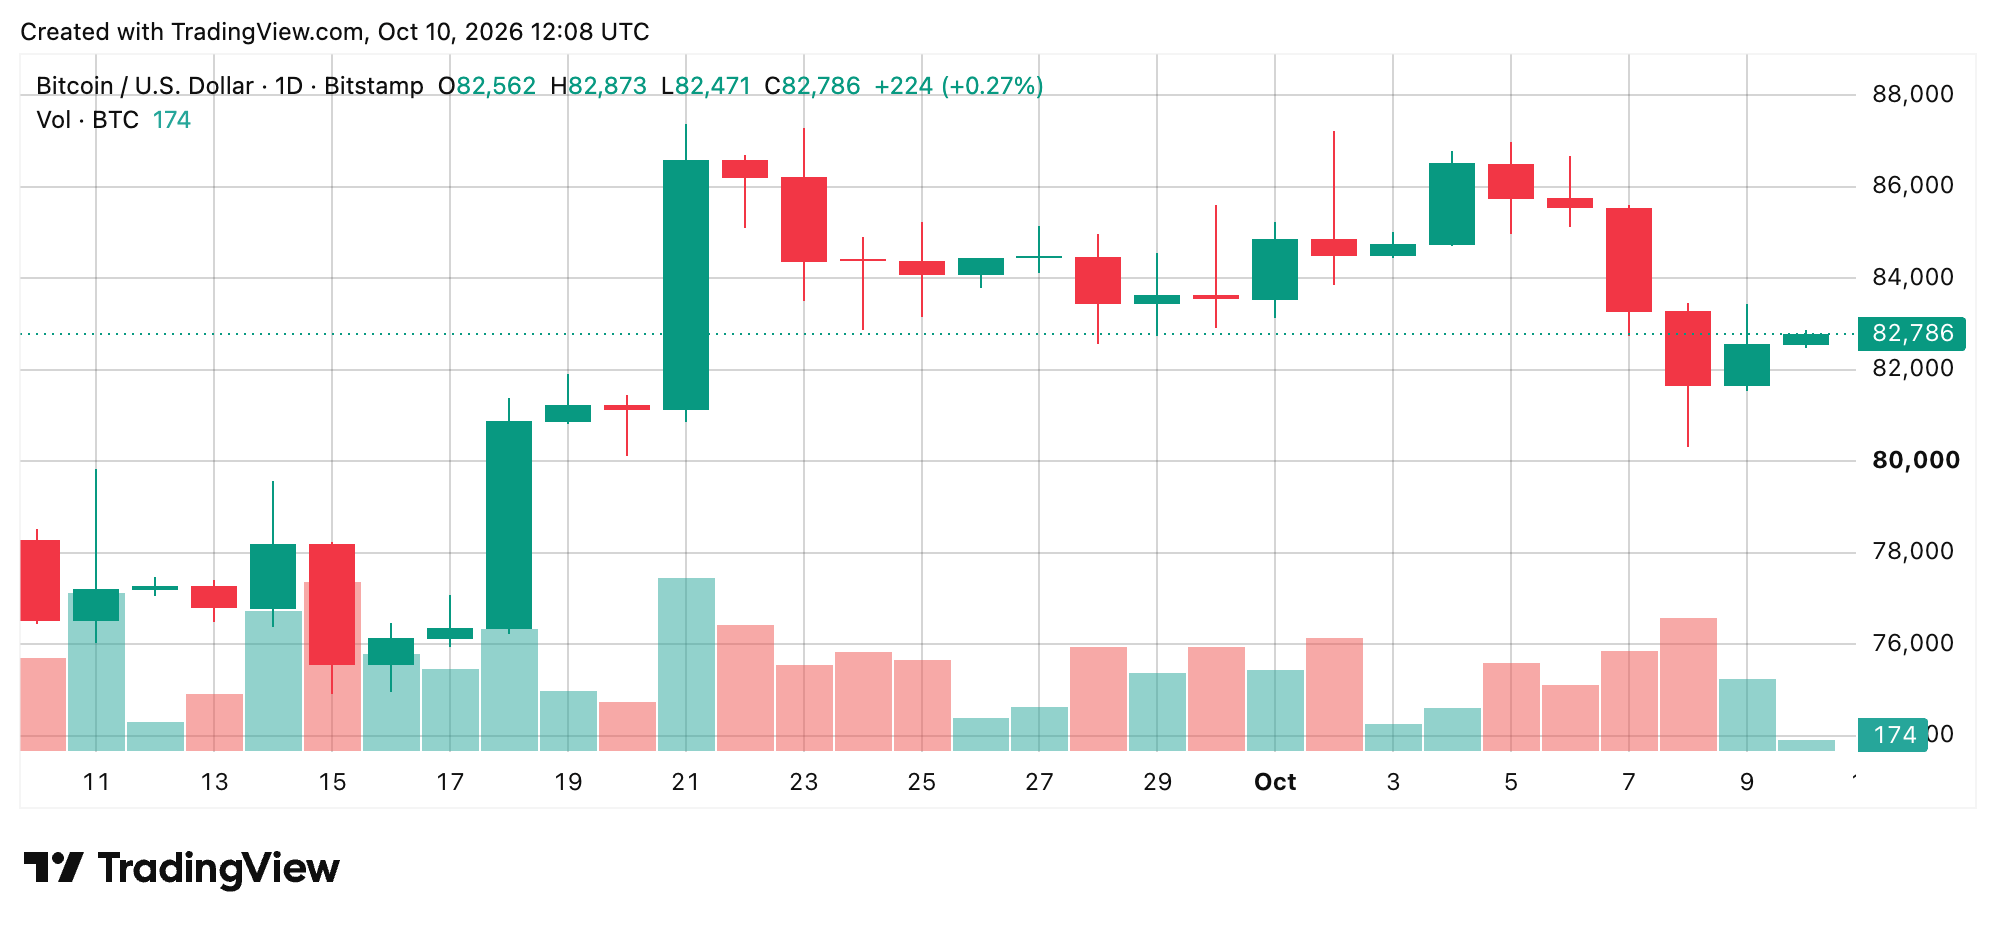
Recent bullish interest around $81,500 to $82,000 has helped contain downward pressure, although the recovery remains relatively modest. A daily close above $84,000 would improve the technical picture, while a breakdown below $80,308 would threaten the existing range and potentially expose the psychological $80,000 threshold.
Oscillators Offer Little Directional Conviction
The oscillator tape remains predominantly neutral, with eight neutral readings, two bullish signals, and one bearish reading. The relative strength index (RSI) stands at 51, indicating balanced momentum, while the Stochastic registers a range between 29 and 30. The average directional index (ADX) sits at 35, suggesting an established trend has been present without independently identifying its direction.
Meanwhile, the moving average convergence divergence (MACD) level near 975 maintains a negative signal, contrasting with positive readings from momentum and bull bear power. The mixed readings suggest neither bulls nor bears have established clear momentum dominance.
Moving Averages Favor Bulls, but Short-Term Hurdles Remain
The daily chart’s moving averages present a more constructive picture, with nine bullish readings, five bearish readings, and one neutral signal. Bitcoin remains below its 10-period exponential moving average (EMA) near $83,590 and 20-period simple moving average (SMA) around $84,371, placing immediate resistance directly overhead. However, the 50-period exponential moving average (EMA) at $79,865 and 200-period simple moving average (SMA) at $71,918 remain comfortably beneath current prices.
Bull verdict:
Reclaiming $83,432 and eventually $84,400 would strengthen the recovery argument.
Bear verdict:
Losing $82,200 would weaken the consolidation structure, with $81,500 and $80,308 becoming increasingly important defensive levels.