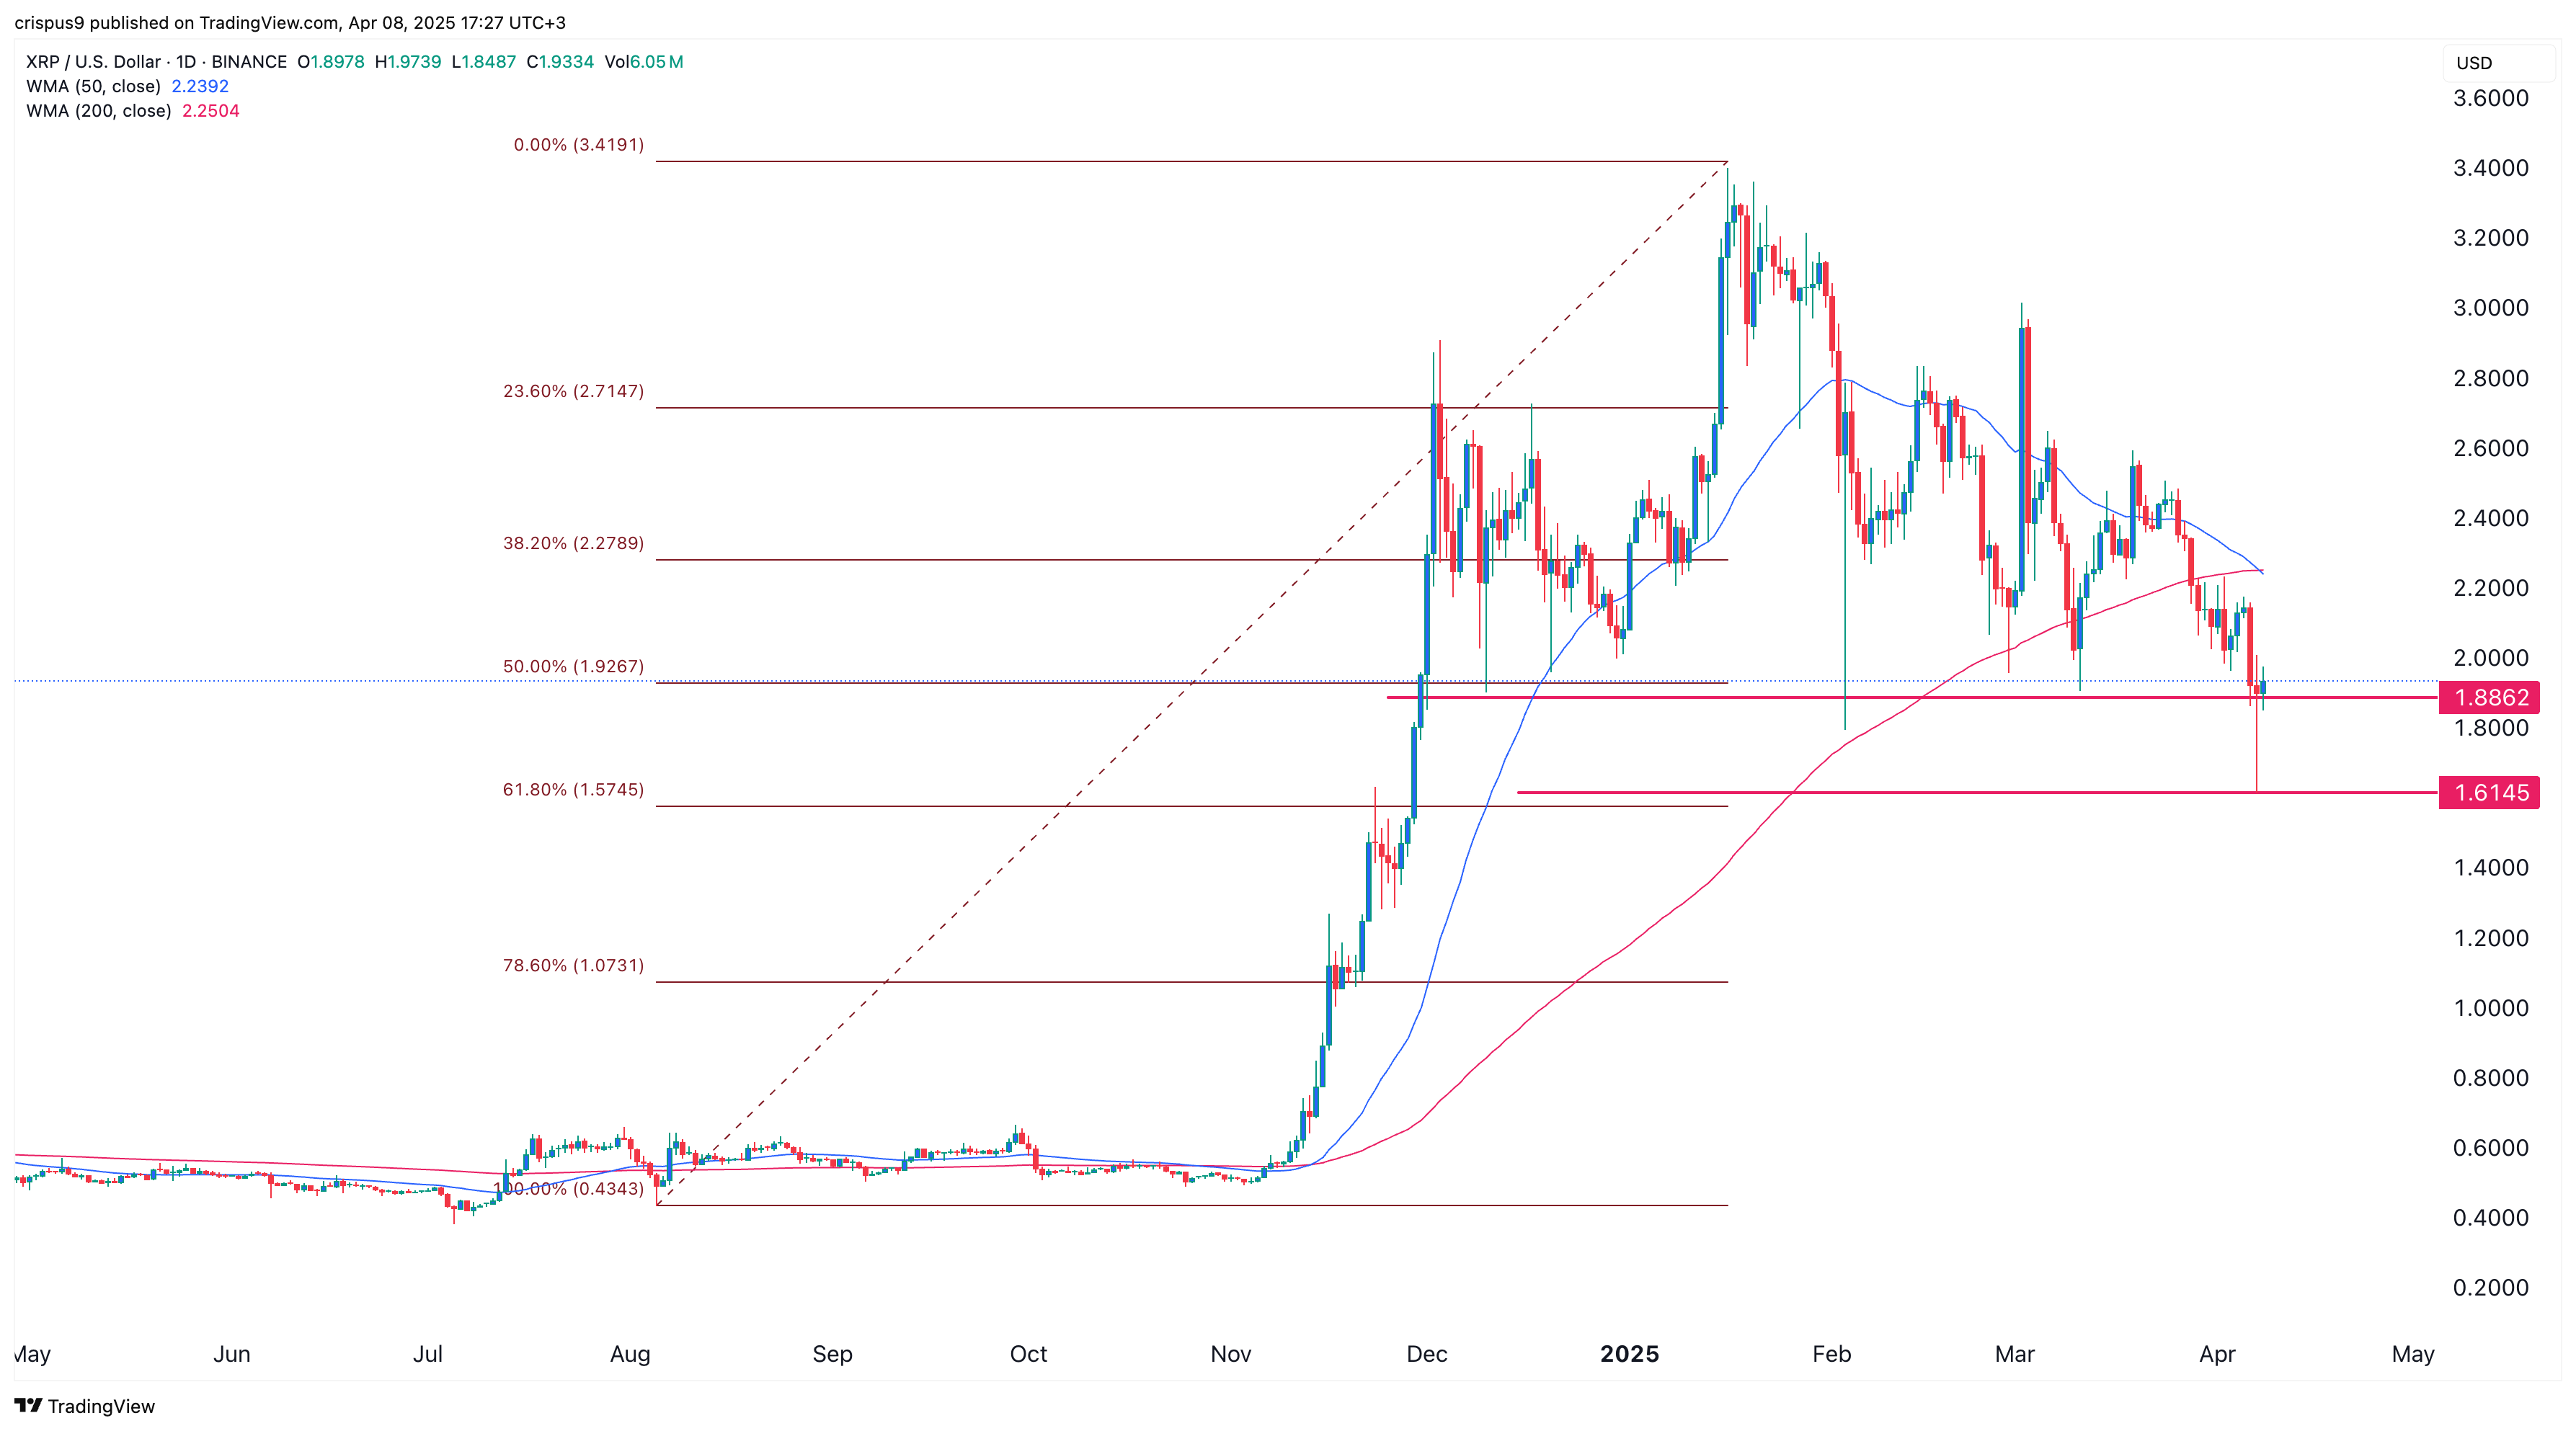
The XRP price has formed a giant doji candlestick pattern, pointing to a potential relief rally after some positive Ripple news.
Ripple (XRP) retested the important resistance level at $2, up about 20% from the lowest level this week. However, it remains roughly 43% below its highest point this year.
The first notable XRP news came from Standard Chartered, which estimated the coin could surge from $2 to $12 over the next four years. Such a move would push Ripple’s market capitalization from the current $113 billion to over $600 billion, assuming the supply remains unchanged.
Analysts cited Ripple’s growing role in the cross-border payments sector, which is currently dominated by SWIFT. Ripple has positioned its solution as more transparent, faster, and more cost-effective. While a typical SWIFT transaction costs between $20 and $50, Ripple’s costs less than $1. Additionally, Ripple transactions are completed instantly, whereas SWIFT transfers often take longer.
In a recent interview, Brad Garlingouse, Ripple’s CEO, noted that the end of the SEC case has led to more partnerships with American companies. Most of these firms kept off Ripple when the case was going on, leading to make more partnerships with international companies.
Standard Chartered also highlighted Ripple’s progress in the stablecoin sector. Its RLUSD token has now reached a market cap of nearly $300 million. Just last week, Ripple integrated RLUSD into its payment network.
The other top Ripple news was its decision to acquire Hidden Road, in a $1.25 billion deal. This acquisition will expand Ripple’s institutional reach by tapping into Hidden Road’s established customer base.
XRP price technical analysis as it forms a doji candle

On the daily chart, XRP fell to a low of $1.6145 on Monday, marking its lowest level since November and aligning with the 50% Fibonacci Retracement level. This decline came as broader crypto markets dropped amid ongoing trade jitters.
Following the sell-off, XRP formed a giant doji candlestick, typically characterized by a long upper and lower shadow and a small real body. This pattern often signals a potential trend reversal, which helps explain the token’s bounce back toward the key $2 level.
However, XRP price still faces some substantial risks ahead. For one, there is a risk that this rebound is a dead cat bounce or a bull trap. Such a price action is usually a temporary rebound that leads to more downside.
Another risk is the possibility of a break-and-retest pattern, where an asset breaks below a key support level and then retests it from below. In this case, XRP’s retest of $2, the neckline of a bearish head and shoulders pattern that formed between November and this week, could indicate more downside ahead.
Lastly, XRP has already formed a death cross, with its 50-day moving average crossing below the 200-day moving average. This bearish signal suggests that the downtrend may resume, potentially pushing the price below $1 in the short term before any eventual recovery.


