

Ethereum is testing a critical support confluence below $2.4K as its correction continues. Buyers have defended the area with several sharp reactions, but persistent lower highs suggest that selling pressure has yet to ease.
Ethereum Price Analysis: The Daily Chart
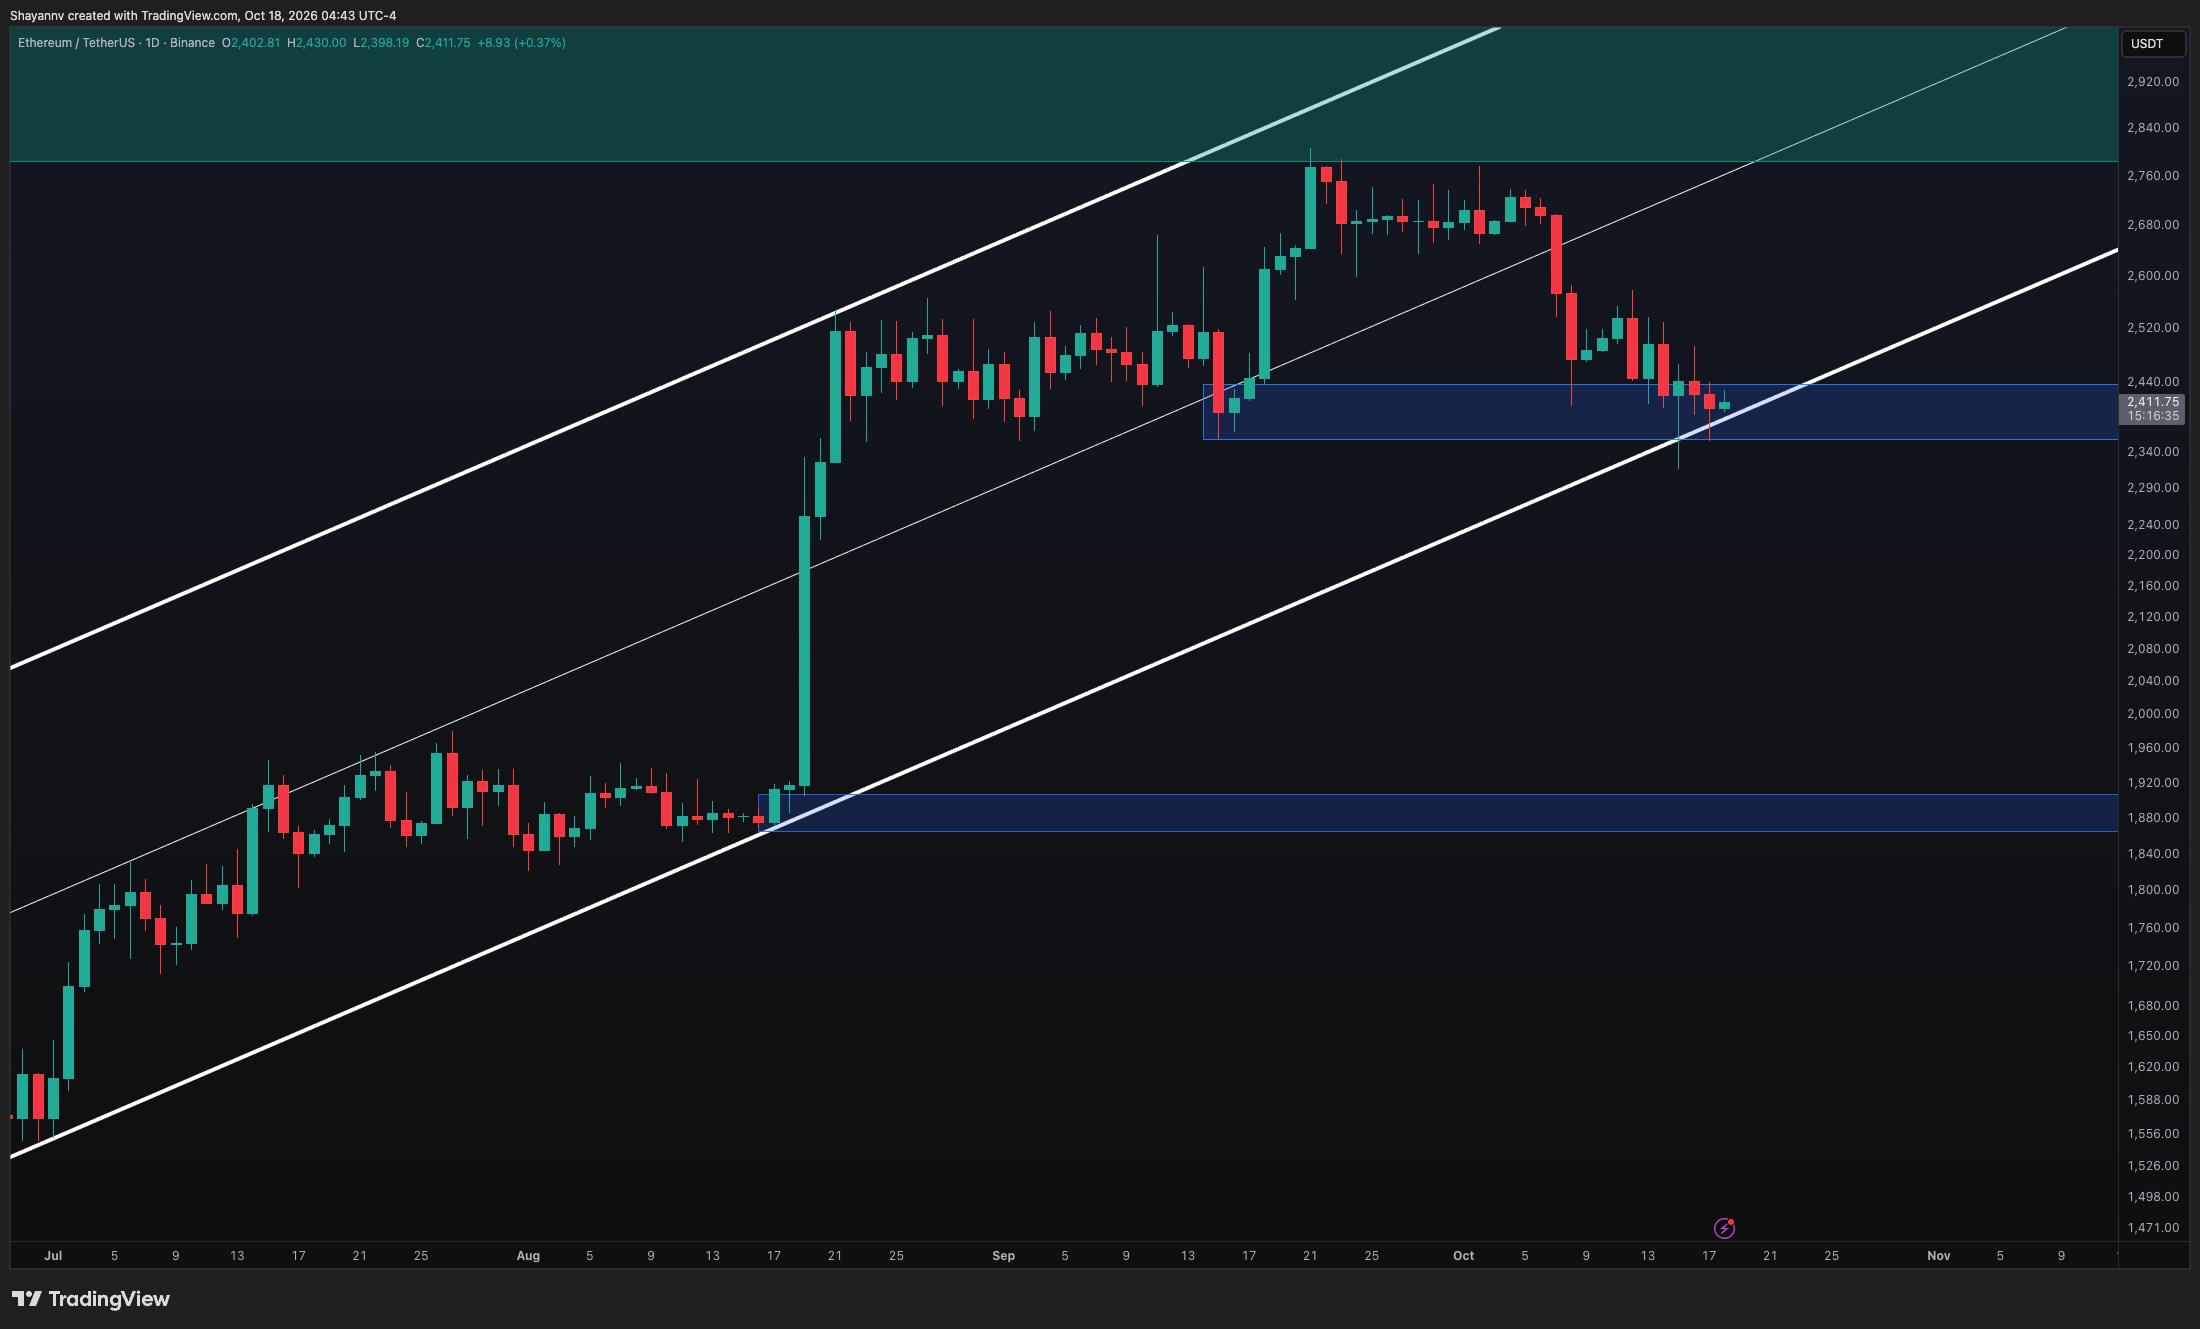
On the daily timeframe, ETH has declined into the highlighted $2.36K–$2.44K demand zone, where the lower boundary of the broader ascending channel provides additional support. The asset is currently near $2.36K, with recent lower wicks indicating buying interest beneath the consolidation.
However, these reactions have not produced a sustained recovery. Since losing the channel’s midpoint, ETH has continued to form lower highs, keeping the immediate outlook fragile. Buyers need to reclaim the $2.44K demand boundary and then overcome the recent $2.5K–$2.56K resistance area to demonstrate improving strength.
Holding the current confluence could support a recovery toward the former consolidation around $2.67K–$2.74K. Conversely, a decisive daily close beneath $2.36K and the ascending channel boundary would weaken the broader recovery structure, increasing the risk of a deeper correction toward $2.2K.
ETH/USDT 4-Hour Chart
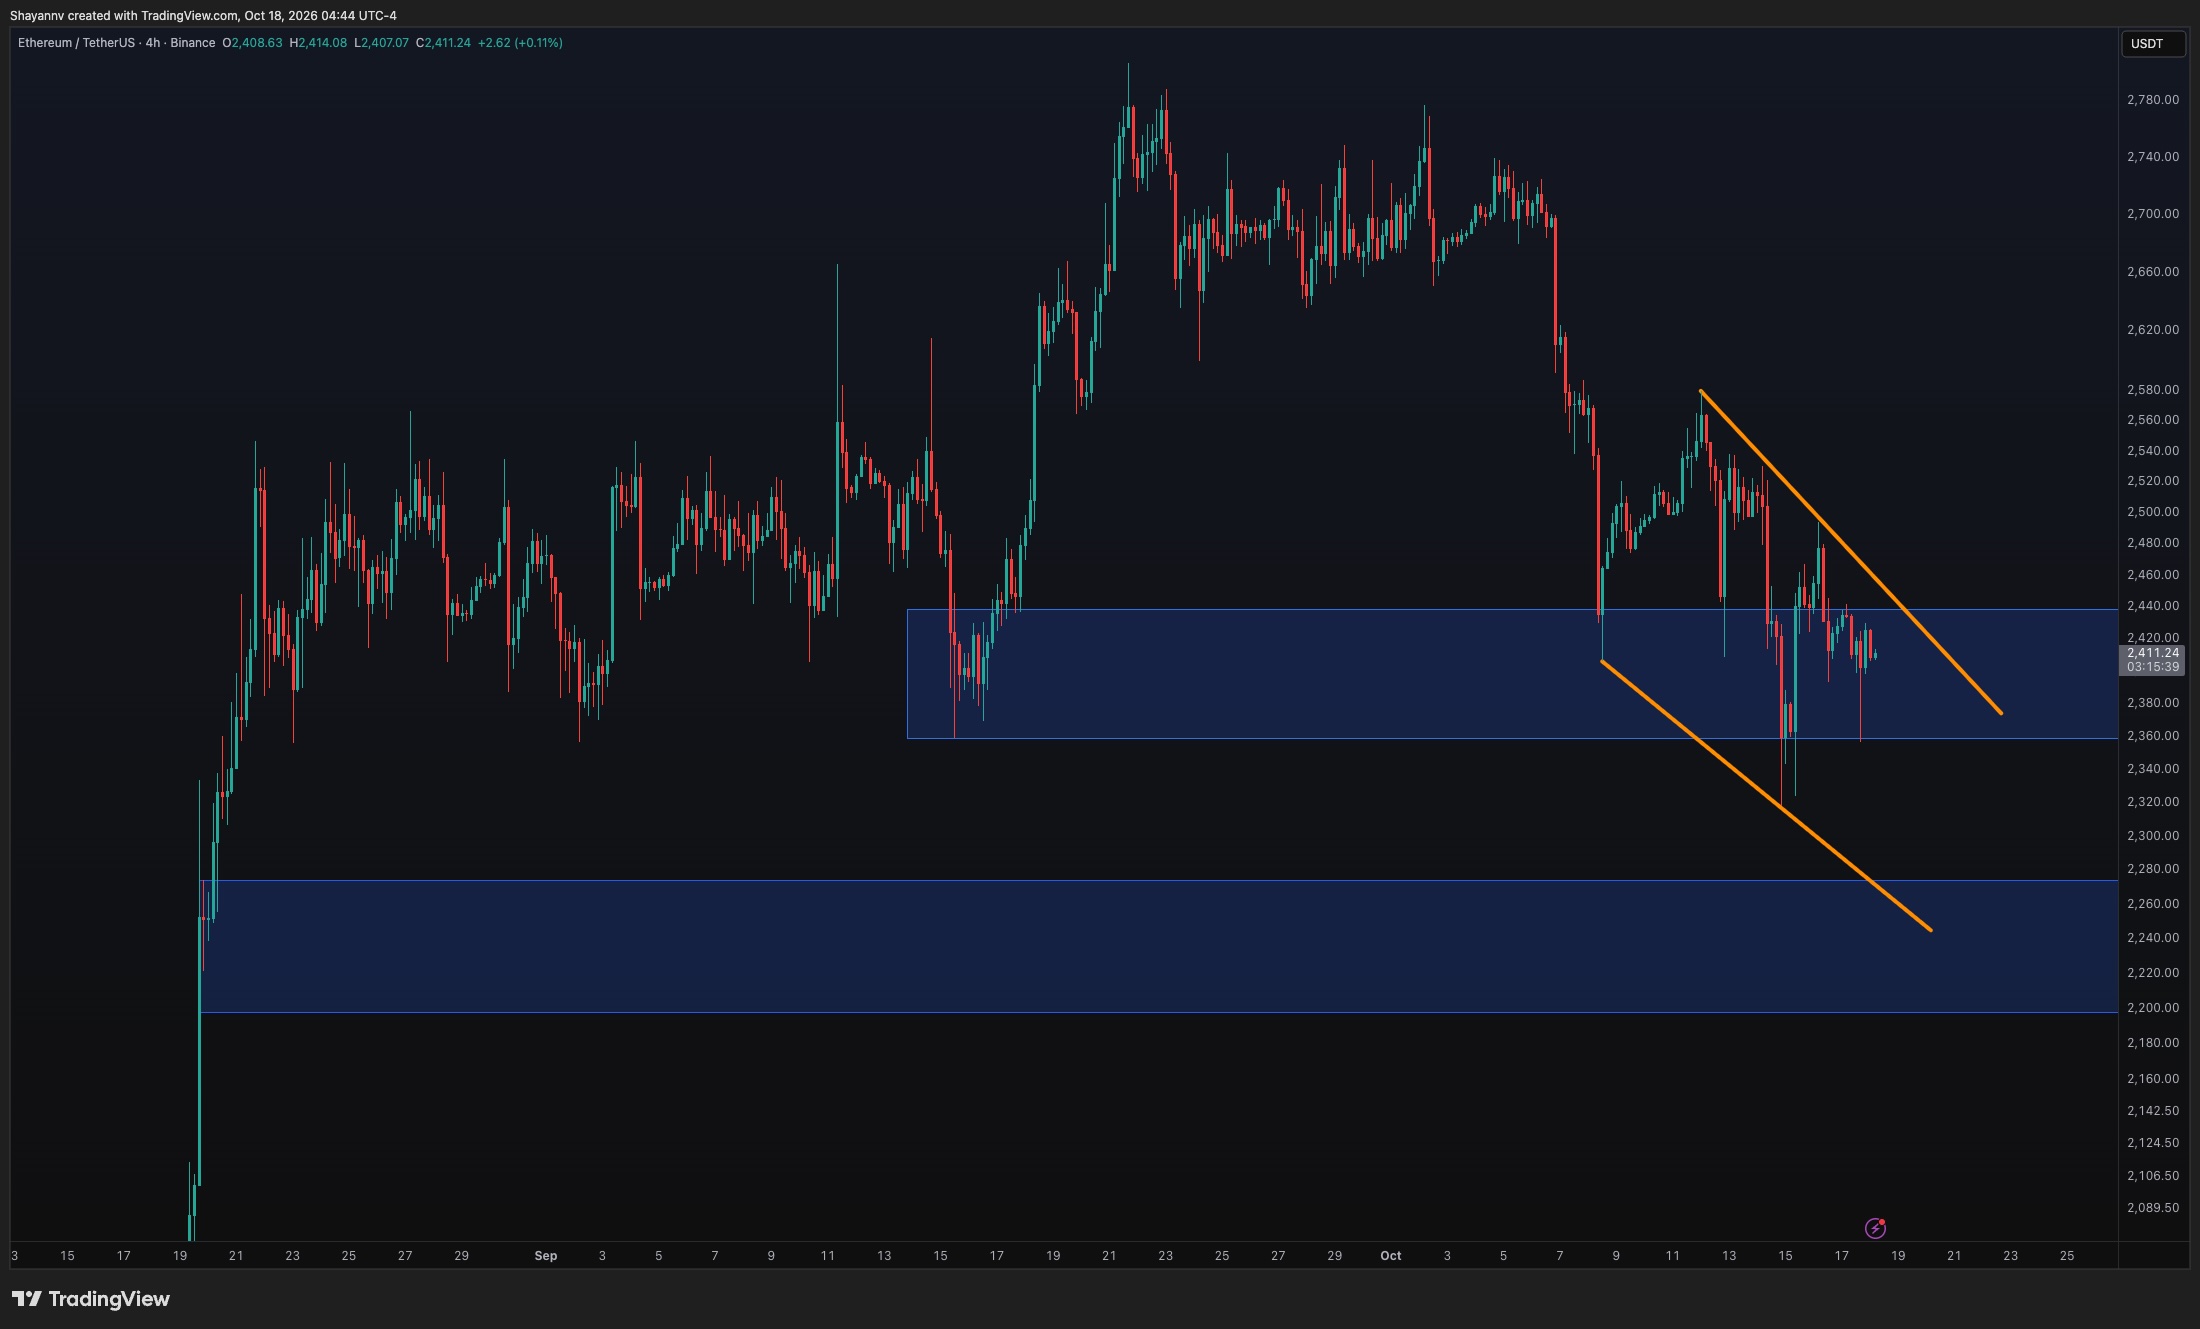
The 4-hour chart shows Ethereum trading within a descending channel following the sharp early-October selloff. Repeated rebounds have failed to break the upper trendline, while the latest candles are consolidating inside the $2.36K–$2.44K demand zone.
The descending resistance currently approaches $2.45K–$2.47K, making this the first important obstacle to a recovery. A sustained breakout above both the demand zone’s upper boundary and this trendline would interrupt the immediate bearish structure and could allow a move toward $2.5K–$2.58K.
Until that occurs, another test of $2.35K remains possible. Losing this support would expose the recent wick lows around $2.32K, followed by the highlighted $2.2K–$2.27K demand zone. The descending channel’s lower boundary also approaches that deeper region, reinforcing its relevance if the correction extends.
Sentiment Analysis
The one-month ETH liquidation heatmap highlights a substantial estimated liquidation cluster around $2.15K–$2.2K, above the psychological $2K threshold. The band has remained visible across multiple sessions and is particularly bright near the chart’s latest readings, indicating a significant concentration of potential liquidation exposure below the current price.
This cluster becomes especially relevant if Ethereum loses the $2.36K support zone and its broader ascending structure. Under that scenario, further declines could trigger long liquidations as the price approaches $2.2K, potentially accelerating the move into this liquidity pool.
Its proximity to the $2.2K–$2.27K technical demand zone adds significance to that broader area. However, the cluster represents potential forced-selling exposure rather than guaranteed support or an inevitable price target. A sustained recovery above nearby resistance would reduce its immediate relevance, while continued structural weakness would keep it in focus.

The post Ethereum Price Prediction: Is ETH’s 7% Weekly Drop Just the Start? appeared first on CryptoPotato.