
This quarter’s ‘State of Crypto Report’ has been made possible through the support of KCEX exchange. Their commitment to fostering understanding in the crypto space aligns with our mission at 99Bitcoins, and we are grateful for their partnership.
The crypto market was one of the strongest-performing markets in the second quarter. In this ‘Q2 2025 Crypto Market Report,’ we found most U.S. equity indices stayed below 15% in quarter-to-date (QTD) gains, only the S&P 500 Information Technology sector stood out with an 18.4% rise; the broader S&P 500 gained just 7.37%. In contrast, the crypto market outperformed them all with a strong 21.72% return.
This marks a solid recovery for crypto after a tough Q1, during which the market dropped by 18%. If we zoom out on the market cap chart, we find that the crypto industry did better this time than in the second quarters of previous years. For instance, it had fallen 14.44% in Q2 2024 and a steep 53.78% in Q2 2021. However, despite the impressive rebound, the total crypto market cap in Q2 2025 was still about 12.40% below its all-time high of $3.71 trillion.
 99Bitcoins found that investors’ interest in crypto picked up in Q2. In April, blockchain-related mentions in SEC filings hit a record high of 5,830, likely due to the Trump administration’s pro-crypto approach. May stayed strong with 5,590 mentions, but by June, the number dropped to around 2,150.
The spike in April shows that many companies were getting more involved in blockchain, possibly launching new crypto products or forming partnerships. Some may also have added more risk warnings to their products because investor activity was rising. Overall, Q2 seemed to be a time when companies were getting ready to benefit from expected support from the government.
Crypto Market Trends Q2 2025: Summary
The second quarter, just like the first, was dominated by geopolitical tensions, economic slowdown, recession fears, increased money supply and greed. But what really stood out was the sharp rise in interest from institutional investors.
Unlike past bull markets, retail investors showed less interest in Bitcoin this time. In fact, out of 10 experts 99Bitcoins spoke to, 9 said that retail traders were shifting their attention to altcoins. Bitcoin, on the other hand, seems to be turning into a favorite among institutions, though many fiduciaries have yet to enter the market.
While analyzing different blockchain layers, we also found development activity on layer-2s was higher than on layer-1s, with many projects choosing Ethereum’s alternative, like Solana, for scalability and economic convenience. One area that caught our eye was DeFAI (Decentralized Finance AI), a growing space that combines artificial intelligence with DeFi. While it’s still early days for DeFAI and the market is largely dominated by memecoins, experts believe the potential for innovation in this field is huge.
Cryptocurrency Market Performance Q2 2025
After dropping to a yearly low of 15 (extreme fear) on 11 March, market sentiment quickly bounced back in April and stayed in the greed zone for over 60 days, thanks to the 90-day pause on tariffs by Donald Trump. But by mid-June, the Fear and Greed Index shifted back to neutral territory, showing that investors were becoming more cautious due to global and economic uncertainty. Yet, they were making bullish bets.
- Bullish bets backed by hiring surge – This growing optimism was further reflected in a massive surge in crypto hiring, which rose by 753%. Most of these roles were for developers and marketing professionals. Well, hiring surges like this are typical during bull markets and reflect strong belief in the industry’s growth potential.
- Stablecoins led sector-wide demand – Among all crypto sectors, Stablecoins saw the highest demand. A recent Coinbase survey showed that 81% of small and medium businesses (SMBs) familiar with crypto are interested in using Stablecoins in their day-to-day operations. It also found that the number of Fortune 500 companies planning to use Stablecoins has tripled since 2024. We can clearly say that the Stablecoin adoption is set to rise sharply in Q3.
- Circle’s successful IPO – Backing this trend is Circle’s successful IPO, which showed that investors are eager to get crypto exposure, even if they are not directly holding these assets. On its first trading day, Circle’s stock price jumped 168%, marking a record-breaking debut for a company that raised at least $1 billion in its IPO. It’s also worth noting that Circle made history as the first Stablecoin company to go public, highlighting how far the industry has come.
- Regulatory clarity – The U.S. govt. made some major moves that broadly supported the crypto market. Key laws and executive orders were passed, and IRS reporting rules for DeFi platforms were removed. U.S. bank regulators, too, relaxed rules around crypto, so banks no longer need to inform the Federal Reserve before engaging in crypto-related activities. These positive changes in the broader crypto market helped boost investors’ confidence in Bitcoin, pushing its dominance to a four-year high of 63%.
A Look at the Crypto Leverage Market
Between 1 January 2025 to 27 May, publicly traded companies that hold Bitcoin in their treasuries borrowed $2.1 billion to buy more BTC. Semler Scientific borrowed $100 million on 24 January with plans to repay it no earlier than August 2030. Likewise, Strategy borrowed an additional $2 billion on 20 February, with repayment set for March 2030.
Crypto-collateralized lending continued to be one of the main ways investors accessed leverage in the crypto market. The average interest rate to borrow Stablecoins dropped significantly, from 11.59% in January to just 5% by 26 May, marking a 56.86% decline in borrowing costs. At the same time, Collateralized Debt Position (CDP) Stablecoins like DAI, which are backed by crypto assets, saw a $1.6 billion increase in issuance, up 25.56%.
Bitcoin futures open interest across all major platforms rose from $101.82 billion on 1 April to $137.70 billion by 26 June. This meant that more money was invested in leveraged trades. In contrast, the futures market for altcoins stayed relatively quiet, showing that most traders were focused on Bitcoin instead. And suggesting that the broader market was far away from the altcoin season.
Meanwhile, crypto venture capital funding held steady in Q2, but Q1 2025 saw a strong surge, with blockchain and crypto startups raising $4.8 billion, the highest quarterly amount since late 2022. In fact, the funding in Q1 alone made up 60% of all VC investment seen in 2024.
Bitcoin’s Quantitative Analysis – Trends & Insights
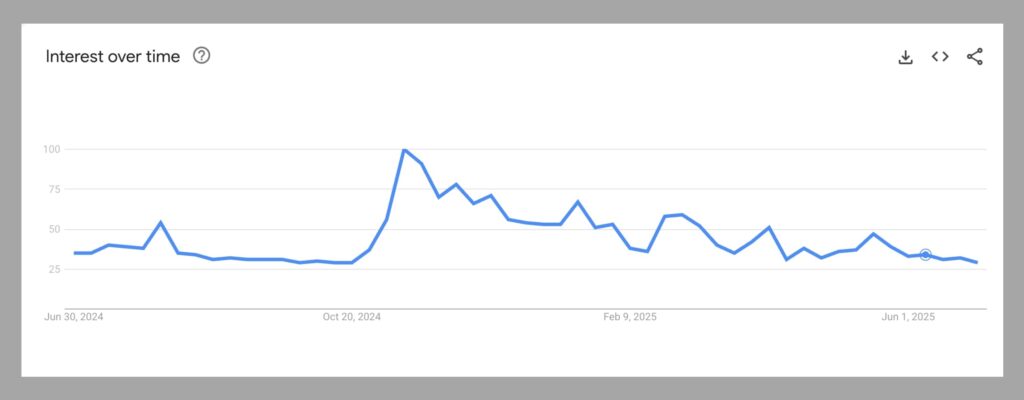
In the current bull run, Bitcoin hasn’t attracted as much attention from retail investors as it did in past rallies. According to Google Trends, searches for “Bitcoin” were quite low compared to the past year, which is surprising, since Bitcoin hit a new all-time high in Q2.
As per the technical analysis of Bitcoin’s 1-Day chart, the king coin was stuck in a downtrend from February to March. In early April, it broke out of this pattern with a strong move up, which marked the start of a new uptrend.
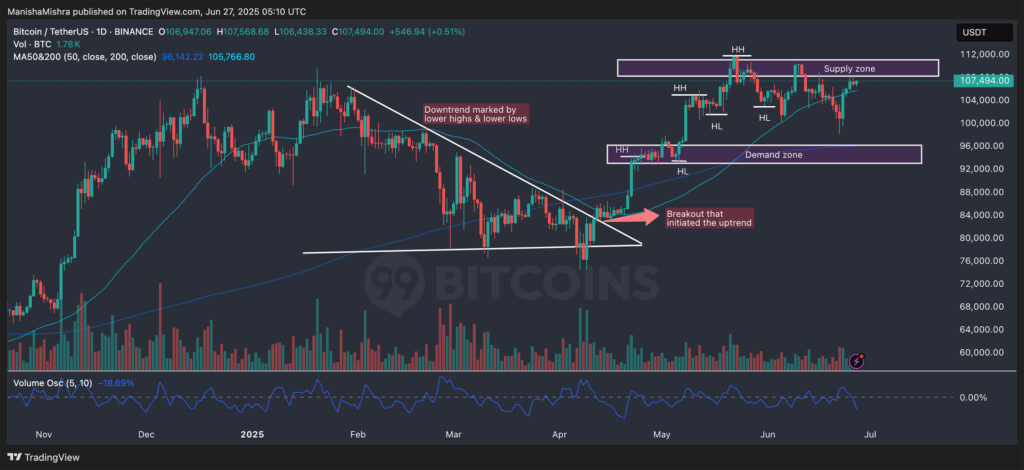
- Towards the end of Q1, a descending triangle formed with lower highs and flat support. This is typically a bearish pattern. But in this case, the breakout was to the upside, as sellers were losing control, and buyers stepped in with great strength. This upside movement was backed by high volume, which initiated the Q2 uptrend.
- Post-breakout, a clear formation of HH (Higher Highs) and HL (Higher Lows) was seen on the chart. This was a sign that investors were accumulating in the hope of profit-taking.
- $92K-$96K level acted as a strong support zone. The price consolidated here and bounced, highlighting the buyers’ conviction. However, $109K-$112K continued to act as a tight supply zone where liquidity was less.
- For all of Q2, Bitcoin treated the 200-day Moving Average (MA) as its support. On 22 May, the 50-day MA sloped and crossed above the 200-day MA. Thus, forming a golden cross. This indicated that the bullish momentum would continue in the next few days.
- The Volume Oscillator showed high activity during the breakout in April. But in late June, it showed a divergence with the BTC price. In essence, it dipped below zero, suggesting that buying momentum was cooling down as BTC approached the psychological level of $110k.
What Influenced Bitcoin’s Price Trajectory?
Several factors have influenced Bitcoin’s price, from macroeconomic trends and fundamental news to on-chain metrics and overall market sentiment.
Macroeconomic Factors
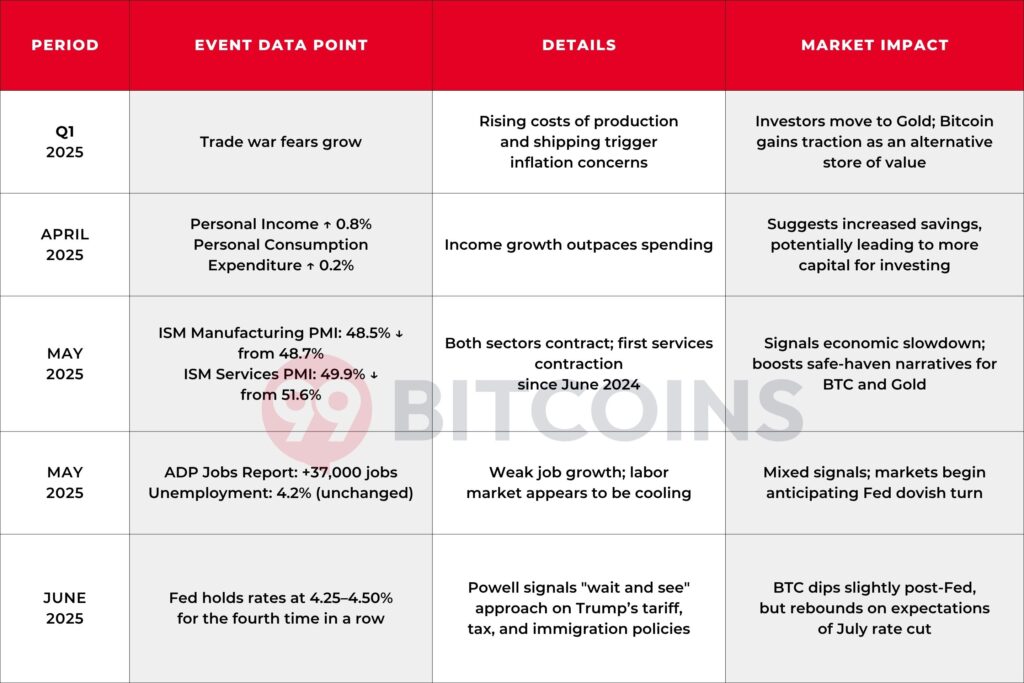
In Q1 2025, growing fears of a global trade war led to concerns about rising prices due to higher production and shipping costs. Because of this, many investors turned to safe-haven assets like Gold. However, Bitcoin also gained attention as an alternative store of value.
This shift in investors’ sentiment coincided with mixed economic signals in the United States. Personal Income increased by 0.8% monthly in April while Personal Consumption Expenditure (PCE) went up by only 0.2%. The ISM Manufacturing PMI dropped to 48.5% in May, from 48.7% in April. This marked the third straight month of contraction in the manufacturing sector. The ISM Services PMI also fell to 49.9% in May, from 51.6% in April. This was the first time the services sector contracted since June last year.
Both manufacturing and services data suggested the economy was slowing. Further, the ADP National Employment Report showed just 37,000 private sector jobs were added in May 2025, and the U.S. unemployment rate stayed at 4.2%. In response to these mixed data, in June, the Fed kept interest rates unchanged at 4.25%–4.50% for the fourth time in a row.
Fed Chair Jerome Powell said the policymakers wanted to see the full impact of President Trump’s policies on tariffs, taxes, and immigration before making any rate cuts. At the back of this announcement, Bitcoin pulled back slightly, but quickly recovered as hopes for a July rate cut grew.
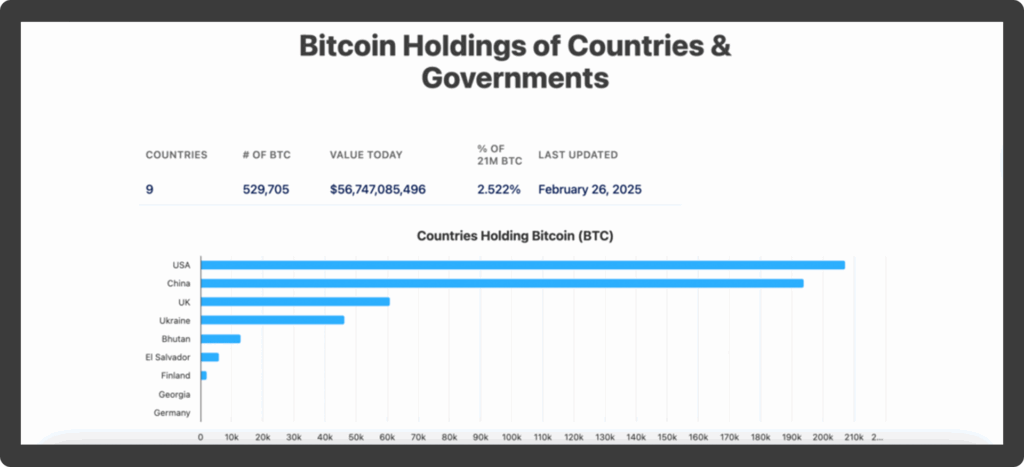
We found that Bitcoin is becoming more popular as a strategic asset for both companies and governments. Today, corporates hold over 5% of all Bitcoin in circulation, which they use as part of their treasury strategy. Governments are also starting to take notice.
Around 2.5% of Bitcoin’s total supply is now held by governments worldwide, with the U.S. alone holding 0.987%. In a 13F filing released on 15 May, it was found that Abu Dhabi’s sovereign wealth fund invested $408.5 million in the iShares Bitcoin Trust (IBIT).
Crypto ETFs and ETPs have made it much easier for investors to get exposure to digital assets without directly buying or storing them. In the U.S., Bitcoin ETFs now have a full year of performance history, which has helped build trust among investors.
As of June’s end, Bitcoin ETF Assets Under Management (AUM) made up 6.35% of Bitcoin’s total market cap, while the total AUM for crypto ETFs stood at $135.08 billion. ETFs have contributed massively to Bitcoin’s rise. Consider this: Net flows into BTC spot ETFs reached $226.70 million, with inflows outpacing outflows over the last three months.

Expressing confidence in the growing ETF market, Chris Wright, Global Head of Marketing at 21Shares told 99Bitcoins,
We believe that Bitcoin ETFs will attract 50% more inflows this year compared to last year. This would result in net inflows of approximately $55 billion in 2025, representing an increase of around $20 billion year-over-year. If this trend continues, the total assets under management could nearly double from just over $110 billion currently, to over $200 billion by the end of the year.
In fact, the latest 13F filings submitted to the SEC by major institutional investors reveal that a growing number of fiduciaries, insurance companies, and other firms are adding Bitcoin ETPs to their portfolios. In an exclusive conversation, Chris Wright said,
This surge signals not just heightened interest, but a deepening conviction in Bitcoin as a long-term, strategic asset, with ETPs becoming the preferred entry point for institutions. Filings showed a 5% increase in institutional holders and a 7% increase from investment advisors. University endowments also continued to enter the crypto space, with Brown University becoming the first Ivy League institution to allocate funds to Bitcoin ETPs.
Besides ETFs, regulatory clarity has also acted as a tailwind for Bitcoin’s upward move. In 2025, the SEC rolled back several enforcement actions and lawsuits against the digital asset industry. The crypto market also saw progress on the Market Structure Bill, which aims to create clear rules for digital assets in the U.S. Further, FDIC and SEC removed barriers for banks to custody digital assets. The Financial Accounting Standards Board also changed accounting rules, simplifying corporate reporting for Bitcoin.
This more relaxed regulatory stance led to a surge in investor confidence, with many making big bets on the crypto market. As we advance, the market will watch developments around U.S. trade policy, which will have a greater impact on crypto prices.
On-Chain Factors
Institutional investors also dominated on-chain activity. As per Glassnode, over 30% of Bitcoin’s supply was held by centralized entities, with a small group of big-pocketed investors owning most of the coins. As more institutional players have entered the market, Bitcoin activity has shifted from on-chain settlements to off-chain infrastructures.
On-chain data showed increased confidence and long-term HODLing behavior among market participants. The yellow line (in the chart below), representing the number of spent UTXOs shows high volatility in Q1 with frequent sharp spikes. However, after mid-March, there’s a visible decline in the intensity of these spikes, highlighting investors’ reduced speculative activity and more confidence in holding.
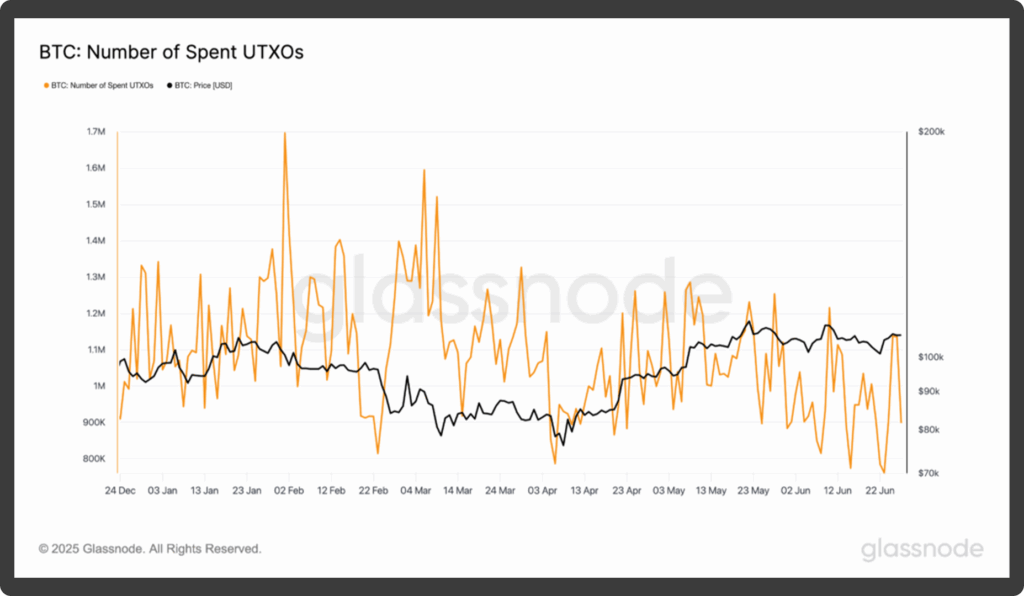
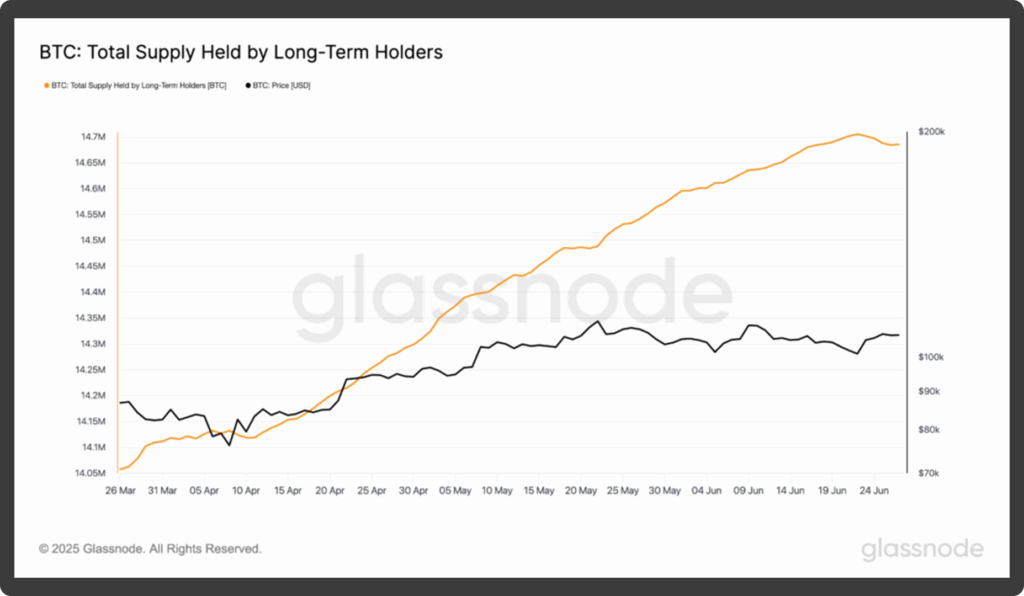
In fact, the exchange inflow volume also decreased in Q2, thus highlighting that investors were moving their Bitcoin away from centralized exchanges to their cold wallets. This observation was also validated by the ‘Total Supply Held By Long-Term Holders’ metric, which saw a sharp and consistent rise throughout the last three months.
It climbed from around 14.05 million BTC to over 14.65 million BTC, indicating robust accumulation. During this time, Bitcoin’s price also saw some sideways movement and slight pullbacks. Despite this, the long-term supply continued to increase, signaling that long-term holders weren’t deterred by short-term price weakness.
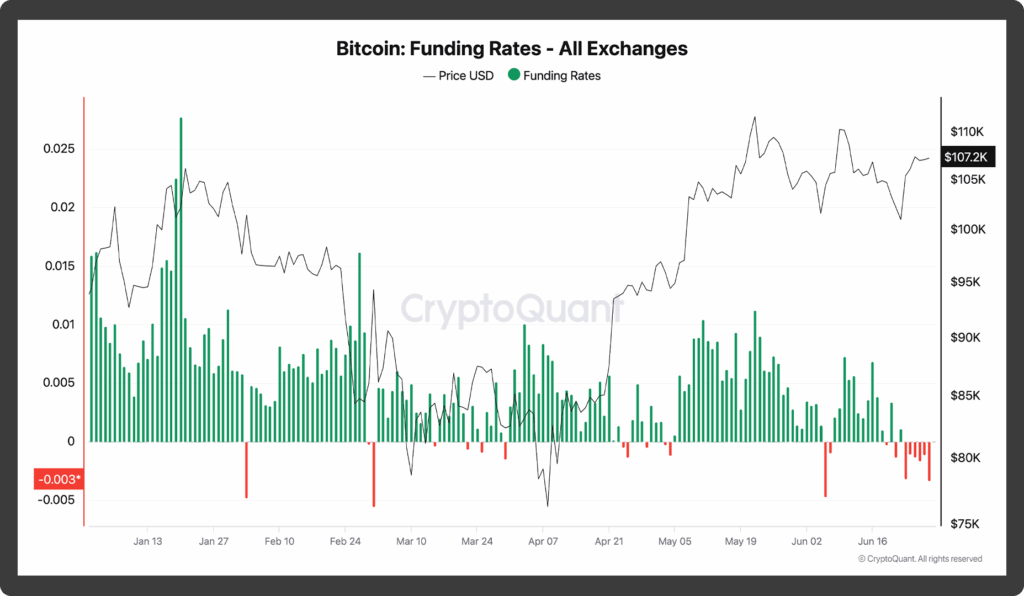
In the derivatives market, long positions outweighed the short positions for the majority of the trading sessions in the second quarter. Both Bitcoin’s price and Open Interest (OI) rose in tandem, revealing more traders opened long positions anticipating further upside. You can consider it a classic sign of a bullish derivatives-driven rally.
In the perpetual futures market, funding rates were predominantly positive throughout Q1 and early Q2, reflecting bullish bias. However, this trend shifted with several dips into negative territory, most notably in late February, March, and again in June. These were the times when aggressive short bets were high. The on-chain activities in the latter part of Q2 revealed there could be heightened volatility in the months ahead.
By the end of June, close to 93% of BTC holders were sitting on profits. While 75% of holders chose to keep their profits for over a year, around 20% held for 1-12 months, and a small group of 4% held for less than a month, pointing to short-term trading activity. Meanwhile, market volatility dropped sharply in Q2, falling from 52.68% in late March to 25.71% by mid-June.
The number of addresses with some sort of balance rose steadily, hitting 53.72 million in mid-June, reflecting growing user participation. Addresses holding more than $1 million in BTC jumped from 124,663 on 14 March to 160,822 by mid-June, again highlighting rising institutional interest.
On the flip side, the number of addresses holding at least one Bitcoin dropped sharply, suggesting some retail holders may have taken profits during the rally. These data sets collectively implied that by the end of Q2, the Bitcoin market was in a strong yet maturing phase.
What’s Ahead For Bitcoin in Q3 2025?
With rising money supply, growing interest from sovereign wealth funds and institutions, clearer regulations, supportive legislation, and a historic supply crunch, Bitcoin appears well-positioned for further upside in the next quarter.
Adding to this momentum are increasing ETF netflows and the likelihood of upcoming rate cuts, all of which could fuel continued price growth. If we look at the technical readings, we can find that the market is in a decisive state.
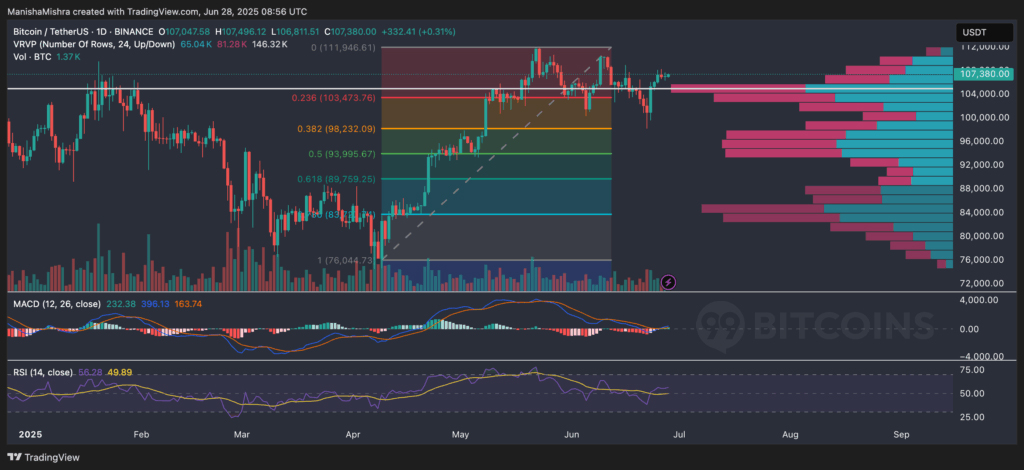
Bitcoin broke above the 0.236 Fibonacci level ($103,473) on 23 June and started treating it as a near-term support. The bulls have been attempting to break above the all-time-high zone of $111,000-$112,000, which has many sellers. On the back of positive macroeconomic developments, if BTC manages to break above this level, we could see the next move toward $120,000, a likely psychological and Fibonacci extension target.
Note that in the chart above, the Fibonacci retracement is drawn from $76,000 to $112,000. If Bitcoin breaks back below $103,000, you can expect a liquidity sweep down to $98,000-$93,000 level, where the buyers will likely step in.
According to the reading of Volume Range Visible Profile (VRVP), there’s a visible demand at the $104,000-$107,000 zone. The Point of Control (PoC) happens to be at $96,000. So, if this fails, the way to $89,000 opens quickly. And once $112,000 is cleared with enough volume, Bitcoin can easily rally to $120,000 level in a matter of a few days.
A clean MACD crossover could signal the continuation of the uptrend. RSI hasn’t reached an overbought level after 22 May, so there are high chances of a price increase.
Bullish Scenario (70% Probability)
For bullish momentum to continue, these factors will have to be checked –
- Bitcoin holds $103,000 level and breaks through $111,900.
- MACD continues rising, and RSI pushes above the 60 mark.
Target zone
- $120,000 can be kept in focus since it will act as psychological resistance.
- $135,000 can only be reached with high ETF inflows and macro tailwinds.
Neutral-to-Bearish Scenario (30% Probability)
In a neutral or bearish scenario, you might see the following events –
- Bitcoin rejects $111,000 and falls below $103,000.
- Volume drops and MACD flattens or turns red.
- RSI dips below 50 and continues to stay sideways.
Target zone
$98,000, $93000, $89,000 – Each level has historic support and fibonacci confluence.
Acknowledging the possibility that Bitcoin might struggle to break past $100,000, Daniel Polotsky, Co-Founder of CoinFlip, told 99Bitcoins,
I believe Bitcoin will end the year well north of $100,000. However, if tariffs lead to significant inflation and prompt central banks to raise interest rates, it could pose a serious challenge. The same concerns apply if the war in the Middle East escalates or a new conflict breaks out.
It’s also important to note that Bitcoin faces an unprecedented supply shock. Spot Bitcoin ETFs have become consistent daily buyers, with their inflows regularly exceeding the 450 BTC mined each day. This widening gap between demand and new supply is rapidly reducing the amount of Bitcoin available in the market.
At the same time, the exchange reserve continues to decline. This simply means fewer coins are available for trading. This scarcity is bound to ignite sharp moves upward.
Historically, Bitcoin’s largest price surges have occurred six to 12 months after a halving event. In both 2017 and 2020, these rallies were fueled by factors like retail enthusiasm and favorable monetary policies. Well, a 10x gain this time might not be possible. Based on past trends, a move that doubles or triples Bitcoin’s previous all-time-high of $69,000 is well within reach.
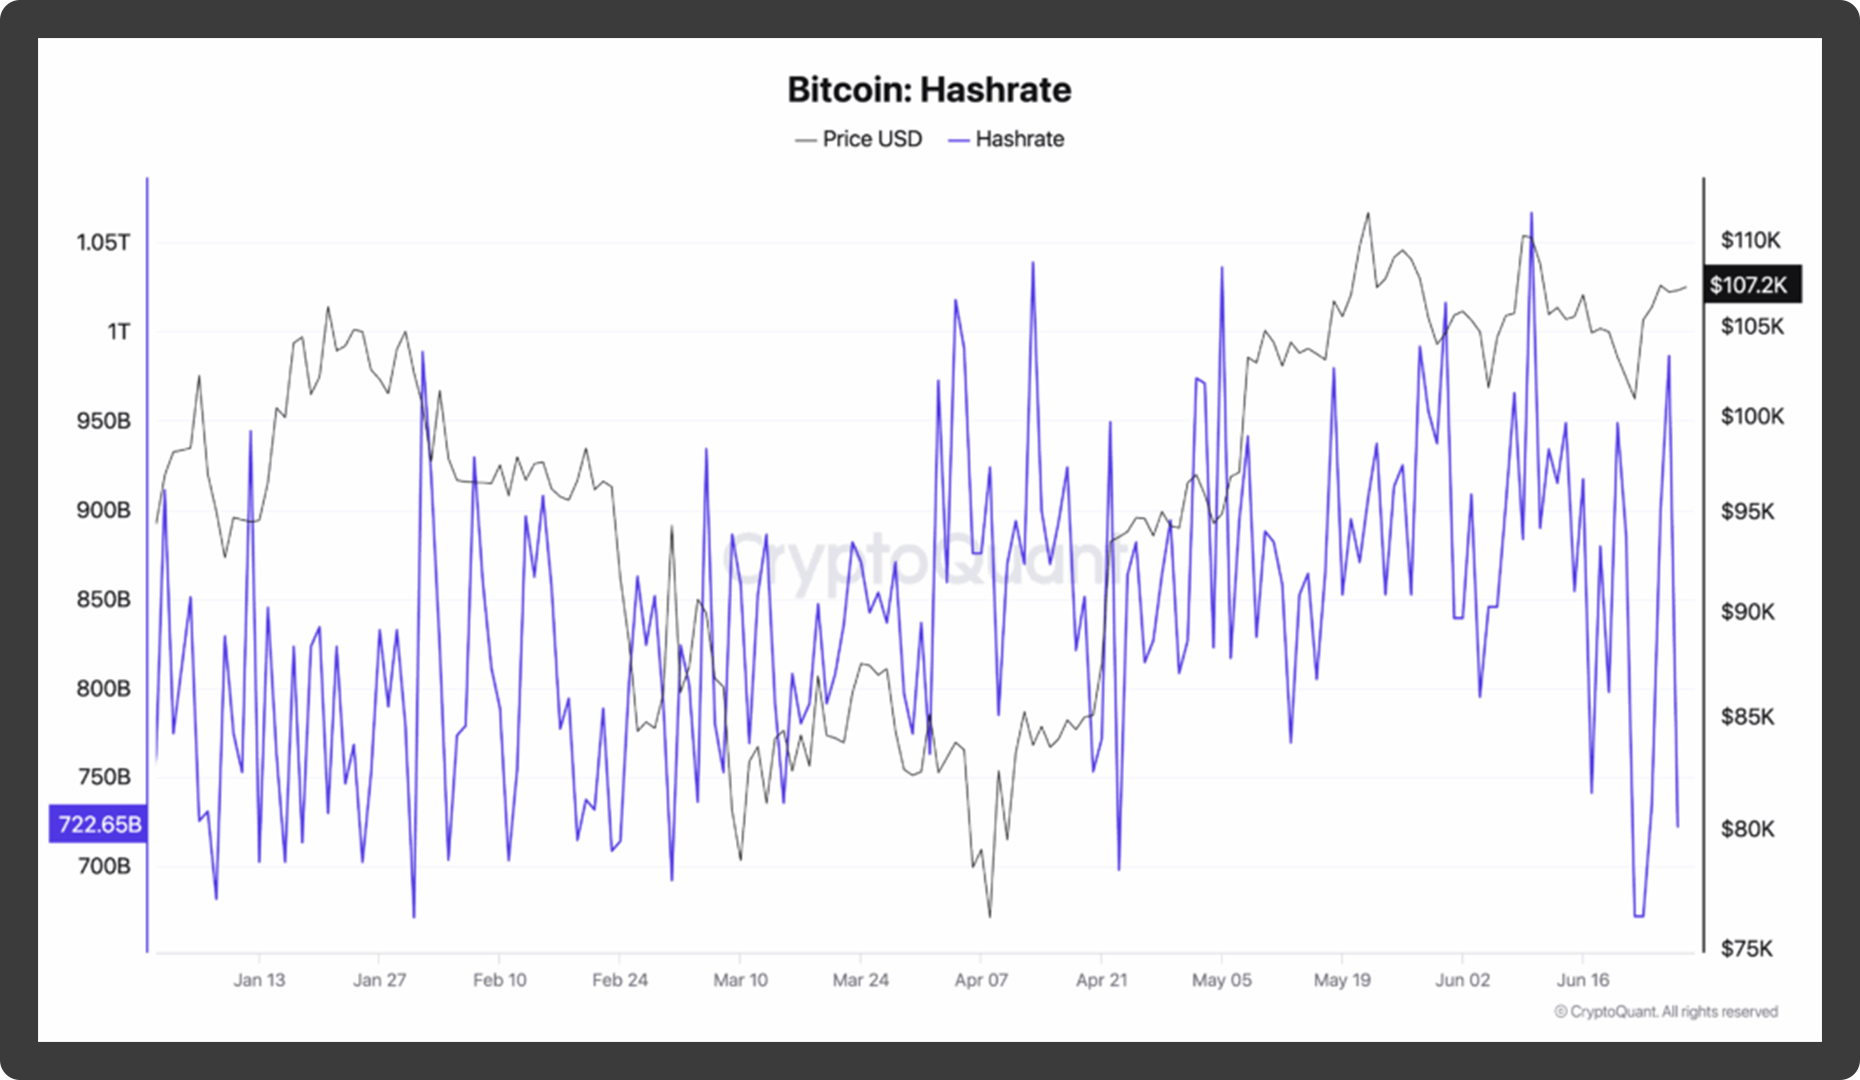
Most importantly, Bitcoin’s illiquid supply kept rising throughout Q2, now surpassing 14 million Bitcoin as more holders move their coins off exchanges and into long-term storage. At the same time, the network’s hashrate has dipped slightly, but miners aren’t rushing to sell.
In fact, miner wallets holding between 100 and 1,000 Bitcoin have increased their balances from 61,000 Bitcoin at the end of March to 65,000 BTC on 27 June, the highest since November 2024. It simply suggests that miners are confident and not feeling the pressure to sell at the current prices.
99Bitcoins’ BTC Price Prediction For Q3 2025
Bitcoin often follows seasonal patterns, usually performing well in Q2 and early Q4, while Q3 tends to be slower due to reduced summer trading activity. In Q3 2025, Bitcoin’s momentum might slow down if ETF inflows drop or global economic uncertainty grows.
However, surprise rate cuts and growing institutional interest could push prices higher despite the seasonal lull. Based on current fundamentals, technical charts, and the broader economic conditions, we believe BTC could hit $120,000 by Q3. If the global money supply keeps rising, Bitcoin might even climb to $135,000 within the next six months.
Ethereum Q2 2025 Outlook
Throughout the quarter, Ethereum’s correlation with Bitcoin moved between 0.49 and 0.98. There was a brief divergence in late June, as ETH pushed above $2,459, its correlation with Bitcoin declined before stabilizing again. The Total Value Locked (TVL) on this layer-1 chain steadily grew throughout Q2, with only minor pullbacks. This indicated that developers continued to favor Ethereum despite ongoing concerns about high gas fees.
Out of the 1,263 protocols on Ethereum, the liquid staking platform Lido held the largest share with $22 billion in TVL, followed closely by AAVE with $21.7 billion. Only 30.94% of addresses holding ETH were making a profit at the $2,439 price level, while 18.47% were in loss, and 50.59% were neutral.
In early January, the MVRV ratio was above 1.5, indicating ETH was trading well above its average on-chain cost basis. From February to April, both the ETH price and MVRV ratio declined. MVRV dropped below 1.0 in March, signaling undervaluation, typically a bullish signal suggesting ETH was trading below what most holders paid.
Interestingly, ETH began climbing again in late April, MVRV also recovered to just above 1.2, highlighting moderate profit levels, but not extreme overvaluation. Around mid to late June, ETH prices increased, but MVRV dipped slightly. This divergence suggested that new buyers entered at higher prices, making ETH more pricey, while also causing the realized cap to go up. Basically, the price of ETH was rising, but the overall profit margin in the market was shrinking.

With favorable regulations expected from the U.S., Ethereum ETF initially experienced net outflows in early April, but the trend soon shifted as the inflows began to rise. The inflows were comparatively lower than what Bitcoin registered. However, ETH ETFs accumulated $11 billion in Assets Under Management (AUM) by the end of June. At the same time, the number of addresses holding at least 10,000 ETH increased during Q2, highlighting whales’ active acquisition.
What to Expect From Ethereum in Q3 2025?
Ethereum’s daily chart showed a clear breakdown from a rising wedge pattern, which typically signals short-term bearish momentum. After peaking below the $3,000 level, ETH failed to break above the near-term resistance zone of $2,950-$3,250.
Following the breakdown in mid-June, the price fell toward the $2,200 level, but managed to recover slightly. In late June, ETH started treating the middle Bollinger Band (BB) as its resistance, and the bands contracted, revealing that the market was indecisive. Chaikin Money Flow (CMF) has been below 0.29 level for most of May and June, indicating mild buying pressure and not a strong accumulation phase. Volume has also been average without a clear signal of trend reversal.
If Ethereum is unable to reclaim the $2,879 level convincingly, it may continue to trade sideways, or it might even revisit the $2,000 support level that has buyers’ dominance. However, if bulls regain control and ETH breaks above $2,879 with increasing volume and CMF confirmation, the price could challenge $3,000 to $3,197 supply zone in Q3. For now, the technical setup favors a cautious outlook.
Overview of Key Crypto Sectors
Among all the sectors, memecoins and AI tokens experienced the highest volatility, marked by sharp price swings and speculative trading. Bitunix‘s analyst informed 99Bitcoins,
Sectors underpinned by real assets or breakthrough technology applications attracted the most capital and investor attention.
In contrast, the NFT market remained largely subdued, continuing the trend of stagnation seen over the previous years.
DeFi Sector
- The Total Value Locked (TVL) in DeFi climbed steadily in early Q2, but declined again toward the end of June. Despite the pullback, it remained above the 15 April low of $86 billion. Ethereum continued to dominate the DeFi space, accounting for 55.78% of the total TVL, while Solana held a 7.62% share.
- Q2 also saw encouraging signals from the Securities and Exchange Commission (SEC). In a roundtable hosted at the SEC’s headquarters, Chair Paul Atkins hinted at the possibility of regulatory exemptions that could allow U.S.-based DeFi firms to operate with fewer constraints.
- Interestingly, Chainlink reached a major milestone in its development work, strengthening its position in the DeFi space. In June, it recorded 363 significant GitHub activities, more than any of its competitors. DeepBook Protocol came in second with 193 GitHub activities, followed by DeFiChain with 152 developmental updates.
- Ripple officially concluded its five-year legal battle with the SEC by withdrawing its cross-appeal. The end of this battle is expected to act as a tailwind, with some experts predicting XRP will cross above $3.4 by the end of 2025. XRPL usage has been growing across the TradFi sector, particularly for cross-border payments and tokenization. 99Bitcoins also found that XRPL payments made from one account to another increased considerably in June.
- The Decentralized Exchange (DEX) Hyperliquid’s token HYPE increased by 396% between 7 April and 16 June, driven by rising investor interest. In fact, this DEX now leads the decentralized perpetuals market, processing over 70% of DEX perp volume. It has, thus, become one of the biggest players in the DeFi space.
- Recently, Nasdaq-listed Lion Group announced that it will hold $600 million in reserves with HYPE as its main treasury asset. The DEX also delivers a smooth trading experience with features like one-click trading, direct deposits from over 30 chains, and easy access to spot, margin, and perpetual markets. Its Unique Active Wallets (UAW) count has also seen considerable growth. Thus, prompting many analysts to predict HYPE token’s surge to at least $50 by the end of 2025.
Stablecoin Market
Q3 has been one of the strongest quarters for the Stablecoin sector. In 2025, Stablecoin usage has steadily grown, with the average circulation supply increasing monthly. Over the past year, total Stablecoin transaction volume surpassed $35 trillion, while the number of unique active addresses reached 265 million.
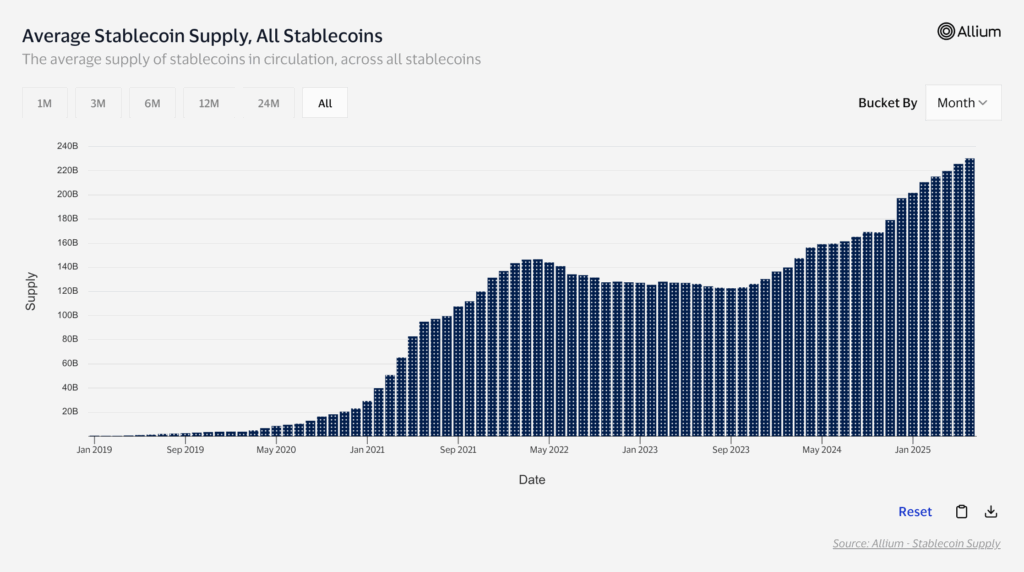
USDT continues to dominate Stablecoin transaction volume. However, USDC is steadily gaining ground, especially following Circle’s successful listing on the New York Stock Exchange. In June, USDT accounted for 68.77% of all Stablecoin transactions, with USDC capturing 30.83%. On the blockchain side, Tron led in Stablecoin volume for most months while Ethereum held the second spot.
The U.S. continues to advance federal Stablecoin legislation with the STABLE Act and the GENIUS Act. With more regulatory clarity, this sector is expected to grow rapidly in the next few quarters.
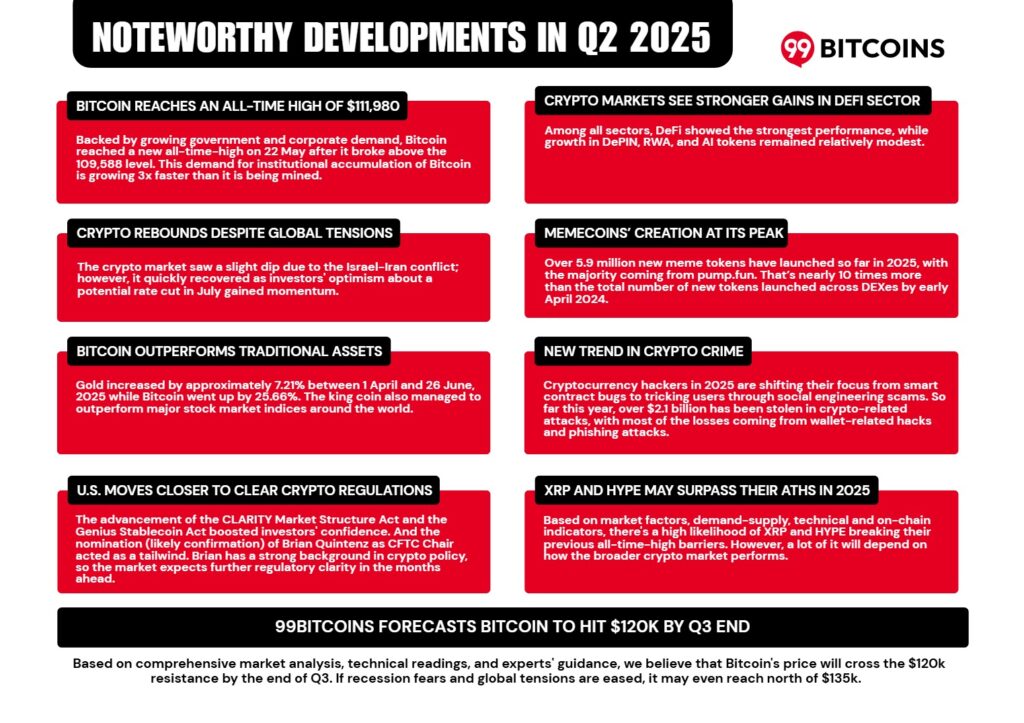
Market Trends in Memecoins
Memecoins creation has surged to new heights in 2025, with over 5.9 million tokens created so far in 2025, with most of them originating from pump.fun. After a sharp decline in Q1, the memecoin market cap saw a modest recovery in Q2, though it remained highly volatile.
Among the top-gainers of all time, PEPE led the way with a shocking 89.93M% gain, while FARTCOIN holds the eighth spot with 2.28M% gain. Interestingly, blue-chip memecoins like DOGE or SHIB were absent from the “Top Gainers” list. This highlights the shift in momentum toward newer and more speculative tokens.

As risk-loving investors continue to flock to memecoins, the crypto market is also witnessing a shift in the nature of crypto-related crimes. Rather than exploiting smart contract bugs, hackers are increasingly focusing on phishing attacks and wallet-related breaches. A significant number of these wallet hacks have targeted addresses holding memecoins as well.
DePIN, RWAs, and AI Token Sectors
- Unlike all other sectors, the DePIN market cap saw a significant fall post-May. Out of 417 projects, Bittensor performed better in terms of price action. This sector is still in its early stage, with many projects being too technical for an investor to understand.
- The RWA sector saw notable growth, with LINK securing the fifth spot on the all-time top gainers list, boasting an impressive 8.39k% growth.
- AI tokens showed better performance in April and May, but struggled in June, with most recording losses. Compared to other sectors, they have yet to generate significant excitement or sustained interest from investors.
Non-Fungible Tokens (NFT) Market
- Despite the ongoing winter, trading volume in the NFT market saw an uptick in the second quarter. The total number of NFT collections continued to grow, and the number of addresses interacting with NFTs also saw a slight increase by mid-April.
- NFT sales reached 51 million by the end of June. However, over the past month, the market experienced a pullback with NFT sales volume dropping by 27% and transactions declining by 52%. Interestingly, the number of buyers rose by 27.85% while sellers decreased by 13%. Thereby, hinting at a gradual shift in market dynamics.
- OpenSea dominated the NFT marketplace with $2.3 million in volume. Meanwhile, NFT volume on the Ethereum blockchain accounted for $22.44 million.
Support Our Research
To continue supporting our research efforts, we kindly ask that you include a link to our ‘Q2 2025 Crypto Market Report‘ if you use any of the data or insights.
References
- SEC Official Site
- Federal Funds Effective Rate
- Glassnode
- Santiment
- IntoTheBlock
- CryptoQuant
- CoinMarketCap
- CoinGecko
- DappRadar
- NFTGo
Disclaimer: This ‘Q2 2025 Crypto Market Report’ offers a detailed overview of the crypto market. The data and analysis are intended only for informational and educational purposes and shouldn’t be considered financial advice.
About Our Proud Partner: KCEX
KCEX is registered as a Money Service Business (MSB) with the U.S. Financial Crimes Enforcement Network (FinCEN). The exchange puts a strong focus on following regulations and complies with local regulatory authorities. Users safety is a top priority for which the platform employs high level security technology. It also protects users through security features like two-factor-authentication (2FA) and cold storage for digital assets.
KCEX is quite popular for offering some of the lowest fees in the industry. It charges 0% for both spot and futures maker fees, with just 0.01% for futures taker fees. The best part is that there are no withdrawal fees unlike many crypto exchanges.
The platform supports over 500 cryptocurrencies, including top coins and newer tokens. KCEX is always quick to list popular, new and legitimate tokens. It offers over 1000 spot pairs and 500 futures pairs for trading. We found that KCEX serves more than 1 million users across the globe, offering easy to use interface and 24/7 multilingual customer support. 99Bitcoins’ experience of using this exchange was absolutely smooth and incredible, with ample liquidity and beginner-friendly features. Go ahead and check out the platform yourself.
The post 99Bitcoins’ Q2 State of Crypto Market Report appeared first on 99Bitcoins.

